Module 9: READING FROM AND WRITING TO FILES
Learning Objectives
After reading this lesson, you should be able to:
read numeric and non-numeric data into MATLAB,
read text (.txt) file contents into MATLAB,
read Excel file contents into MATLAB,
use the concept of a delimiter and commonly used delimiters.
This lesson begins our discussion on data import and export in MATLAB. For a full list of how to load other data types (such as images, audio, and video) into MATLAB, see the documentation on “Supported File Formats for Import and Export”. We will only cover files that contain text data (alphanumeric characters) in this course. We will also focus on text (.txt) and Excel (.xls) files to keep things consistent and simple, but you can review the documentation linked above for specifics on how to use many other common file types.
Why read data from a file?
Applications with large data sets can become laborious and inaccurate if one has to manually input data as variables and arrays into an m-file. Suppose that you are a research engineer working in the materials division of a large company. Your job is to write a program in MATLAB that can determine Young’s modulus of a material from a set of stress vs. strain data, which will be collected from an experimental setup. A data acquisition system from the experiment will store hundreds (if not thousands) of stress and strain values in a file. Entering this data into a m-file would be a long and laborious process subject to entry errors. Obviously, it would be much better to have MATLAB read the data directly from the external (it is external to MATLAB) file.
How do I read numeric-only data from files?
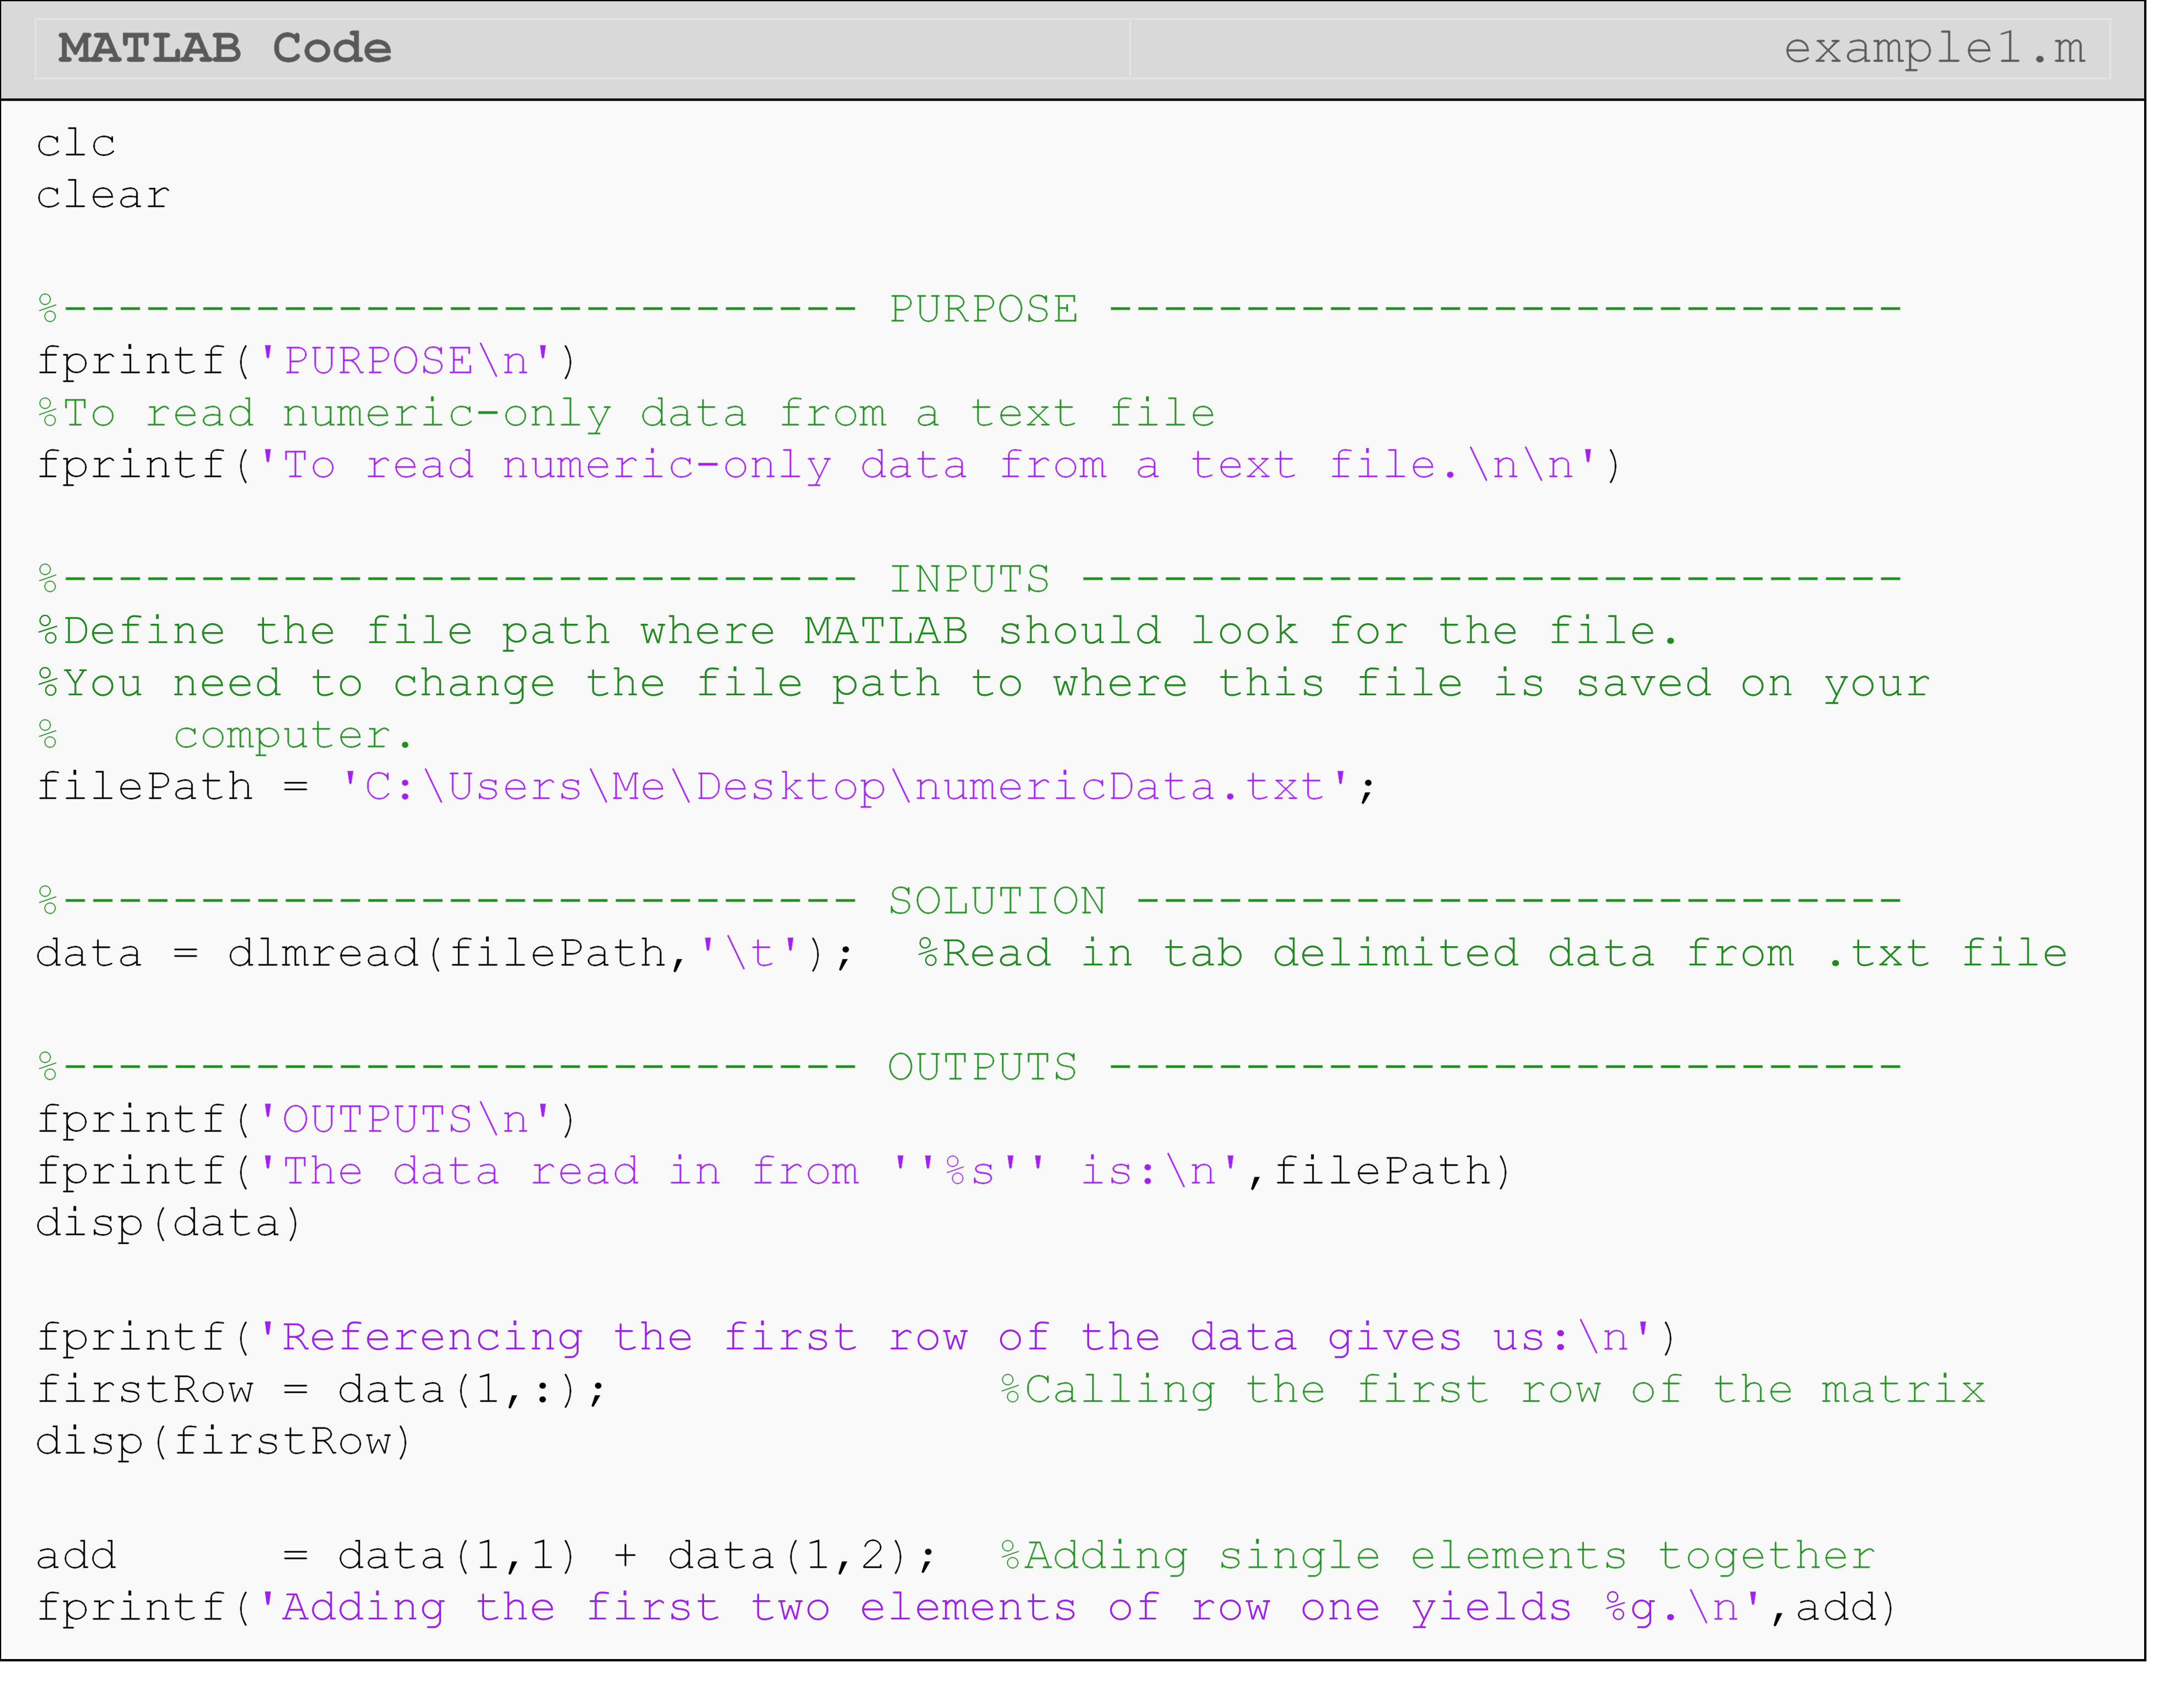
There are several ways to read from files in MATLAB. If your file only contains numeric characters, the simplest way to read the data into MATLAB is with dlmread(). It will read the entire contents of the file, which you can store in a numeric variable such as a numeric vector or matrix (as seen in Example 1).

dlmread() to read
the data into MATLAB. Otherwise, MATLAB will throw an error.
Example 1
Read numeric data (shown below from a Notepad window) into MATLAB from a
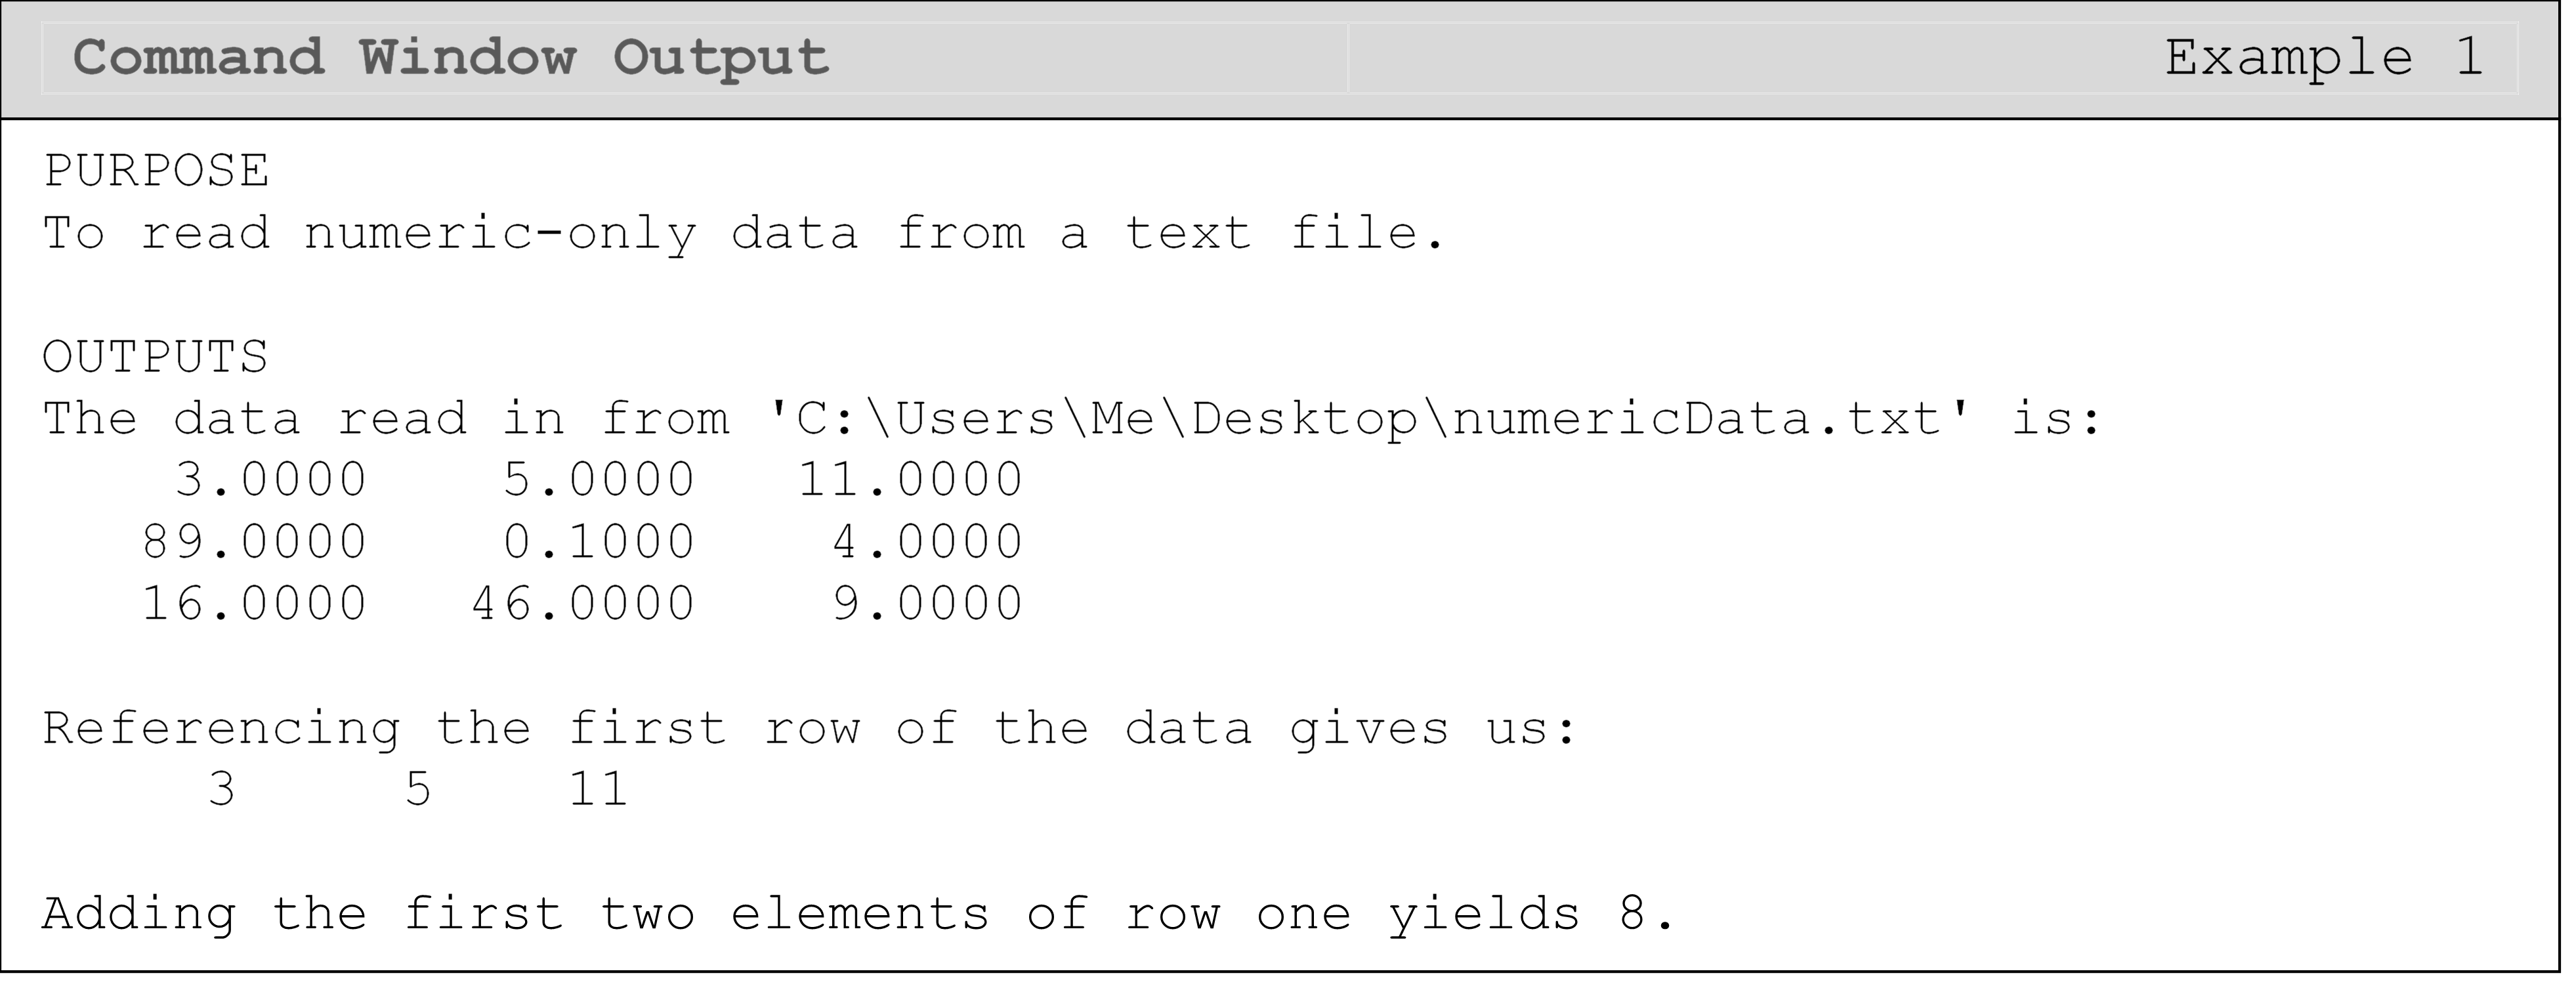
.txt file using dlmread(). Display to the Command Window the
following: all the data, the first row be itself, and the sum of the
first two elements in the first row.
Tabs are used as delimiters (or separators) in this file, which we
specify as ‘\t’. Once the data has been read from the file by
dlmread(), it is automatically put into a matrix, just like we are
used to working with, that contains data. We can use all the normal
matrix operations on it.
Solution
What is a delimiter?
The “delimiter” in a file is what separates one element (number, word,
etc.) from another. Delimiters separate the “columns” of data from each
other. Similar to the syntax for creating columns in a matrix in MATLAB,
common delimiters for text data include tabs (‘\t’), spaces (’ ‘), and
commas (’,’). Note the single quotes are required since they are entered
as strings. As you can see in the output from Example 1,
dlmread()
automatically puts the data from the file into a matrix format where
delimiters define the separate columns and the new lines denote a new
row (like hitting “Enter” on the keyboard in the text file) in the
output matrix.
How can I read numeric and character data from files?
The method we use to read the data in the file depends partially on the
datatype of the data we want to read. Although dlmread()is fast and
easy, it cannot handle files that store non-numeric data such as text
strings. So, if you have a file that contains any characters, you must
use another method.
The method also depends on the type of file where the data is stored.
For example, if we want to read data from an Excel file (.xls,
.xlsx, etc.), a good way to accomplish this in MATLAB is with the
xlsread() function. With xlsread(), both numeric and text data can
be read while keeping the syntax very simple. Carefully review the use
of xlsread() in Example 2 as a specific form must be used to have text
data returned.
Example 2
Read data (shown below from an Excel window) into MATLAB from an Excel
file using xlsread(). Display all the data to the Command Window
including both numeric and text data.

Solution
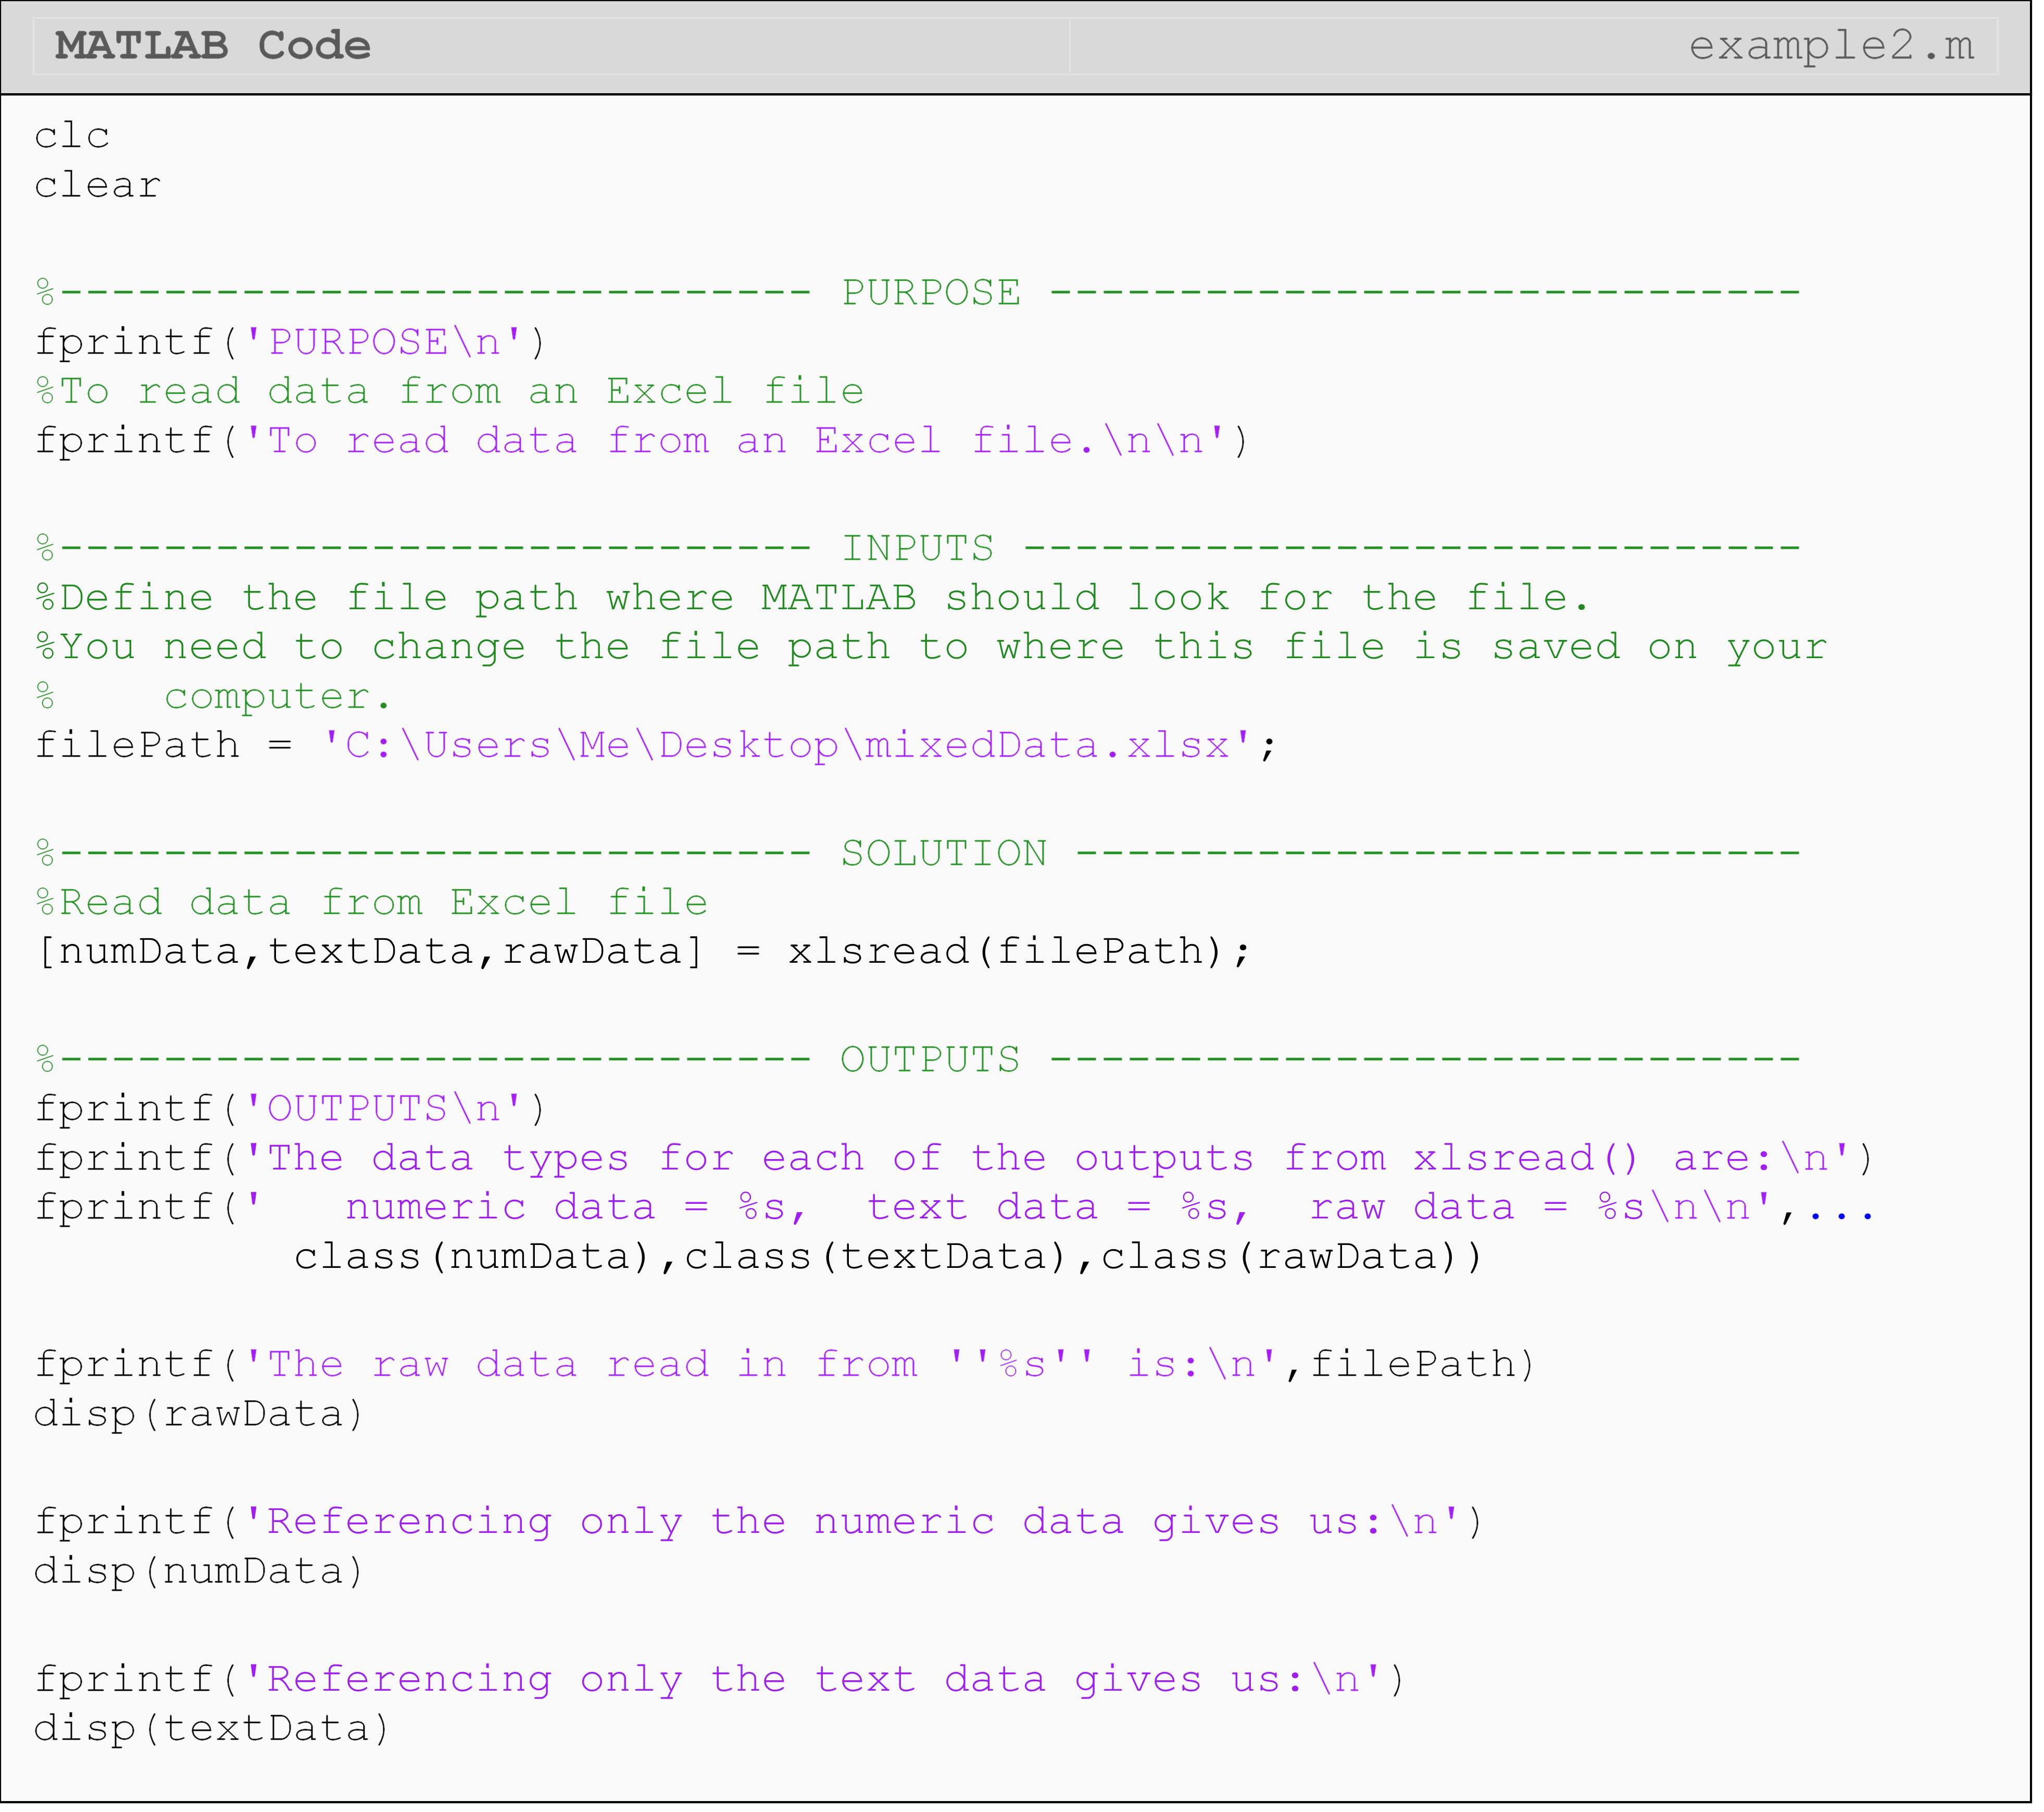
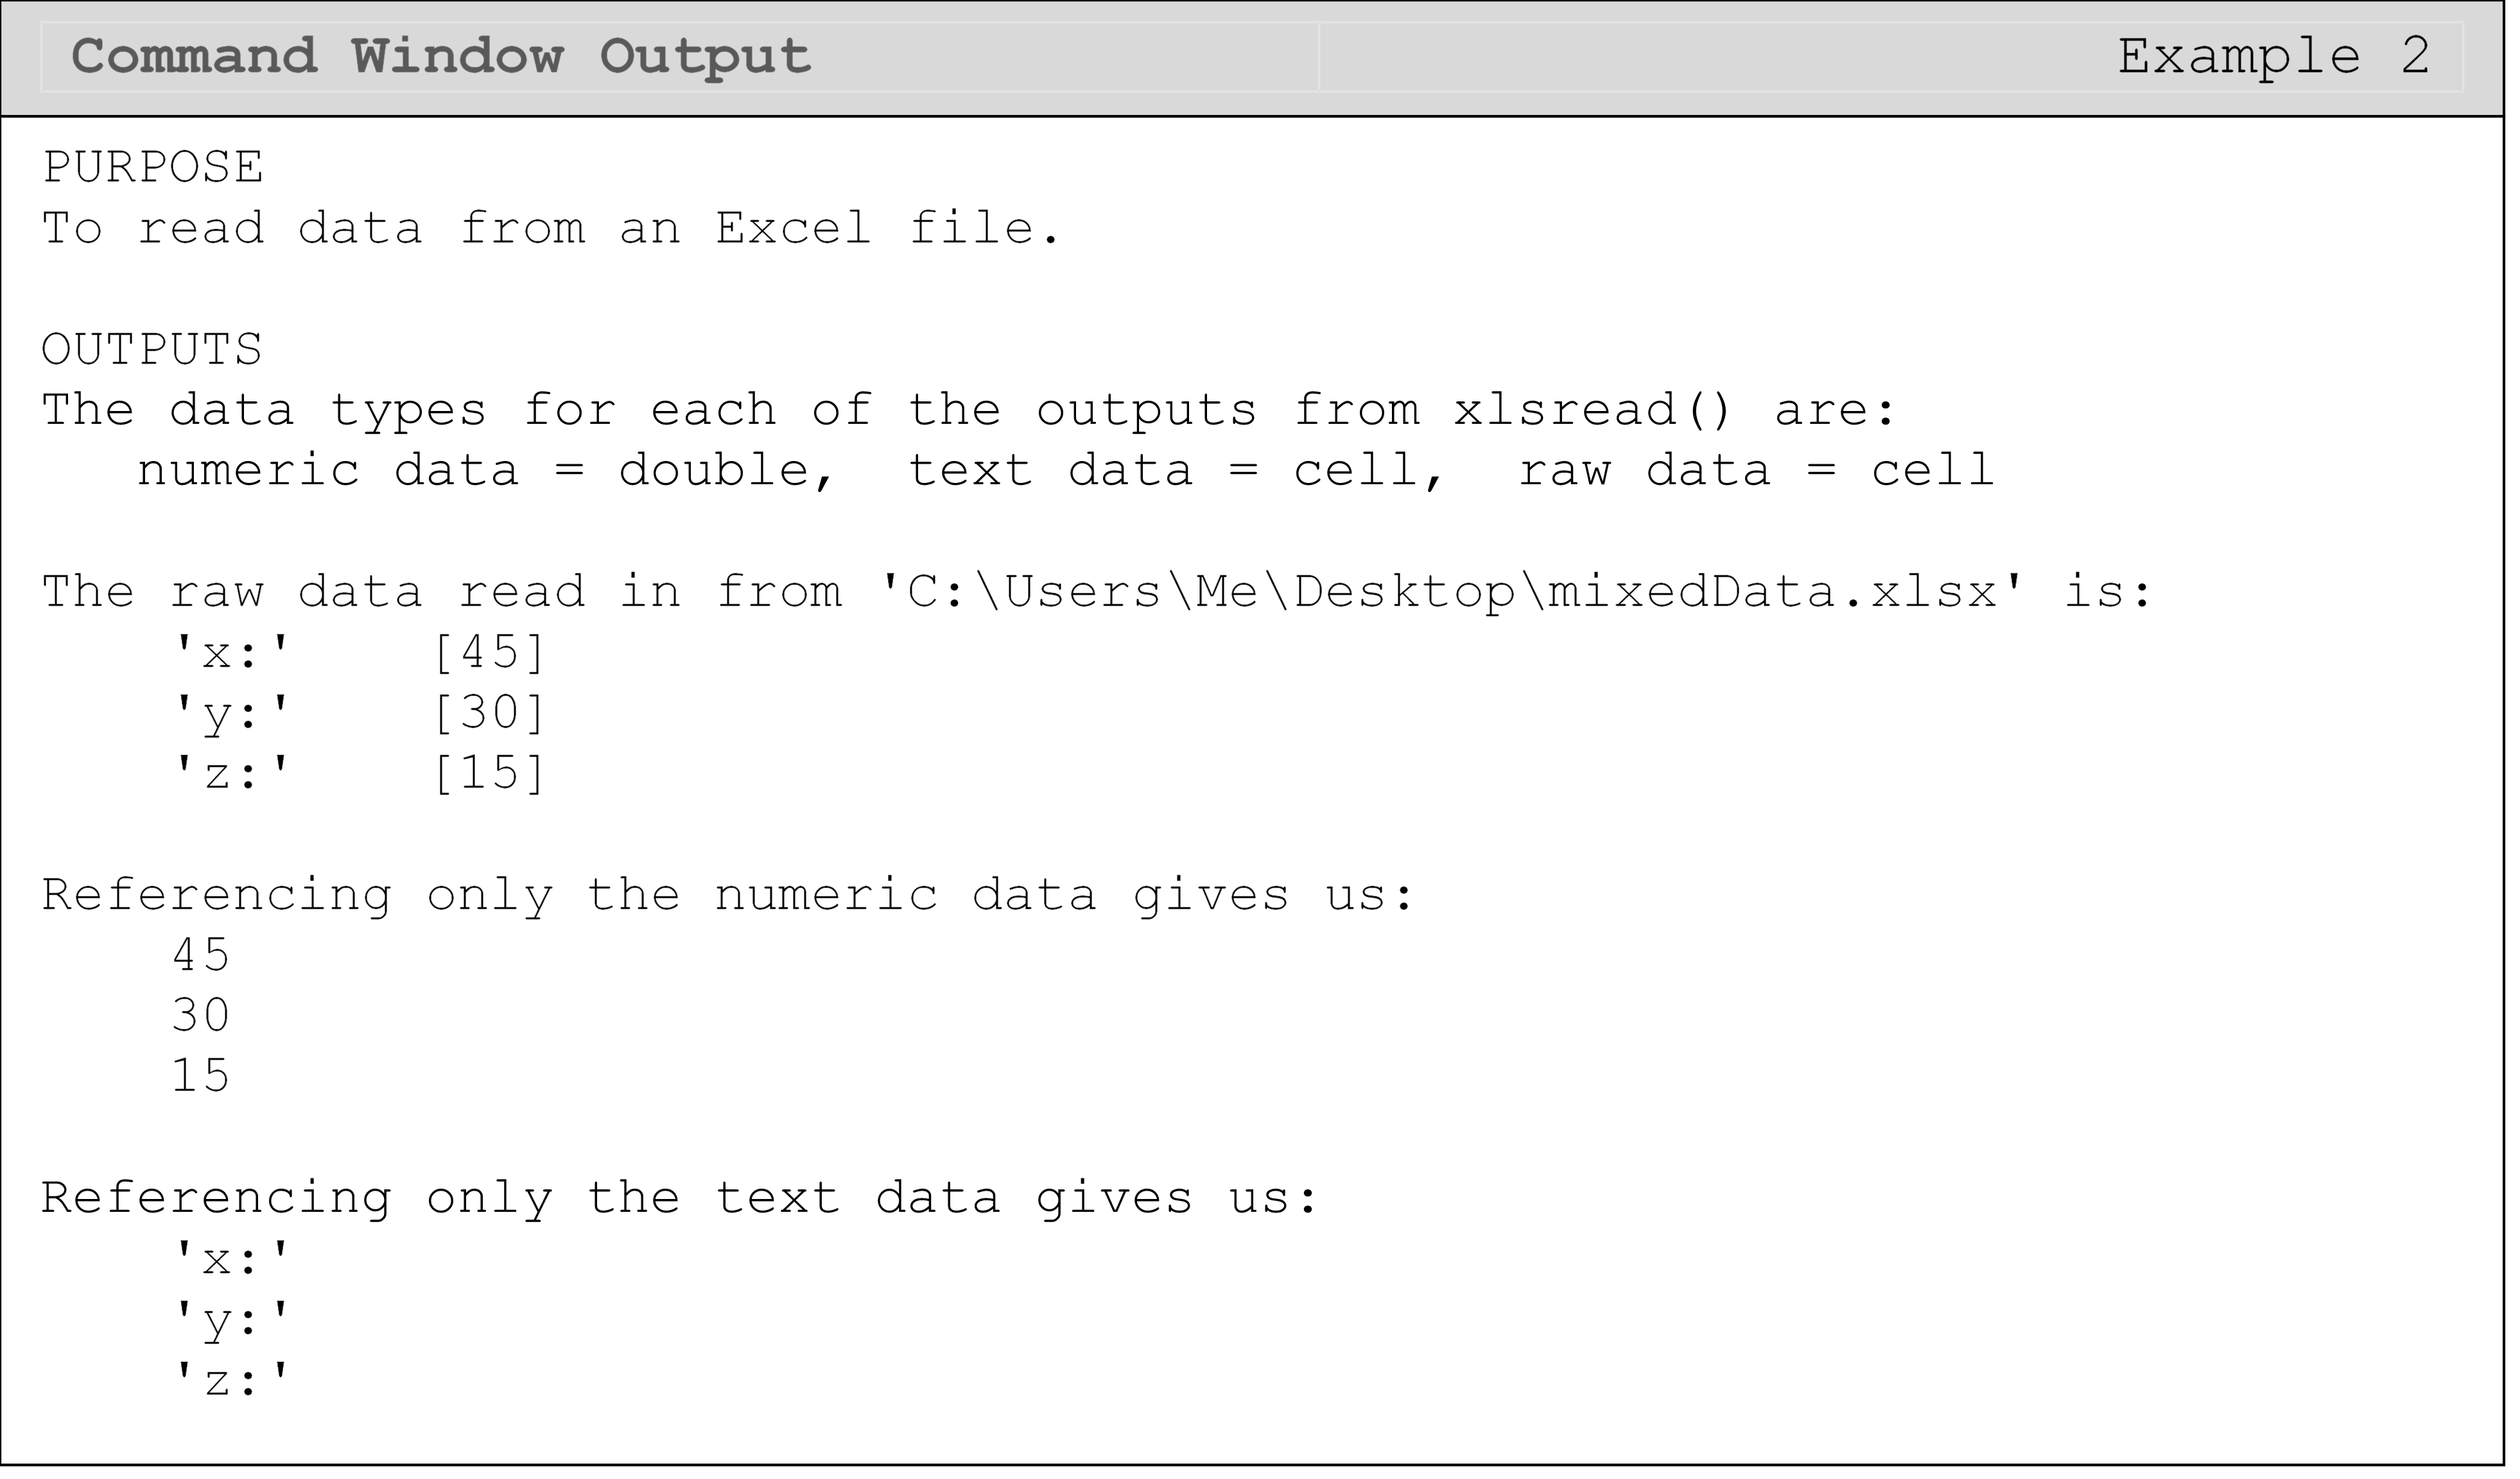
In the solution, the xlsread() function is called with three outputs.
This is done so that we can see all of the numeric and character (text)
data in the file. Calling xlsread() with only one output (e.g.,
data = xlsread(filePath)) will return only the numeric data. For the
text and raw data outputs, there are many helpful MATLAB functions to
process and reformat the string data contained in the cell arrays. We
covered some of these functions in Working with Strings (Lesson 2.3),
but there are others that you can investigate if you are working on a
similar problem in the future.
Another method we can use to read in a file with both character and
numeric data is shown in Example 3, and it uses the function
fgetl().
The downside of this function is it takes a little more code to read the
data into MATLAB, and is explained in Example 3. However, this method
demonstrates a more fundamental approach that is, therefore, more
universal. Understanding this method can also be useful in debugging
errors in file input/output.
Example 3
Read data (shown below from a Notepad window) into MATLAB from a .txt
file. Display all the data to the Command Window including both numeric
and text data. Also find the volume of an object (cuboid) described by
the data in the file assuming the numbers describe the dimension of the
box along that axis.

Solution
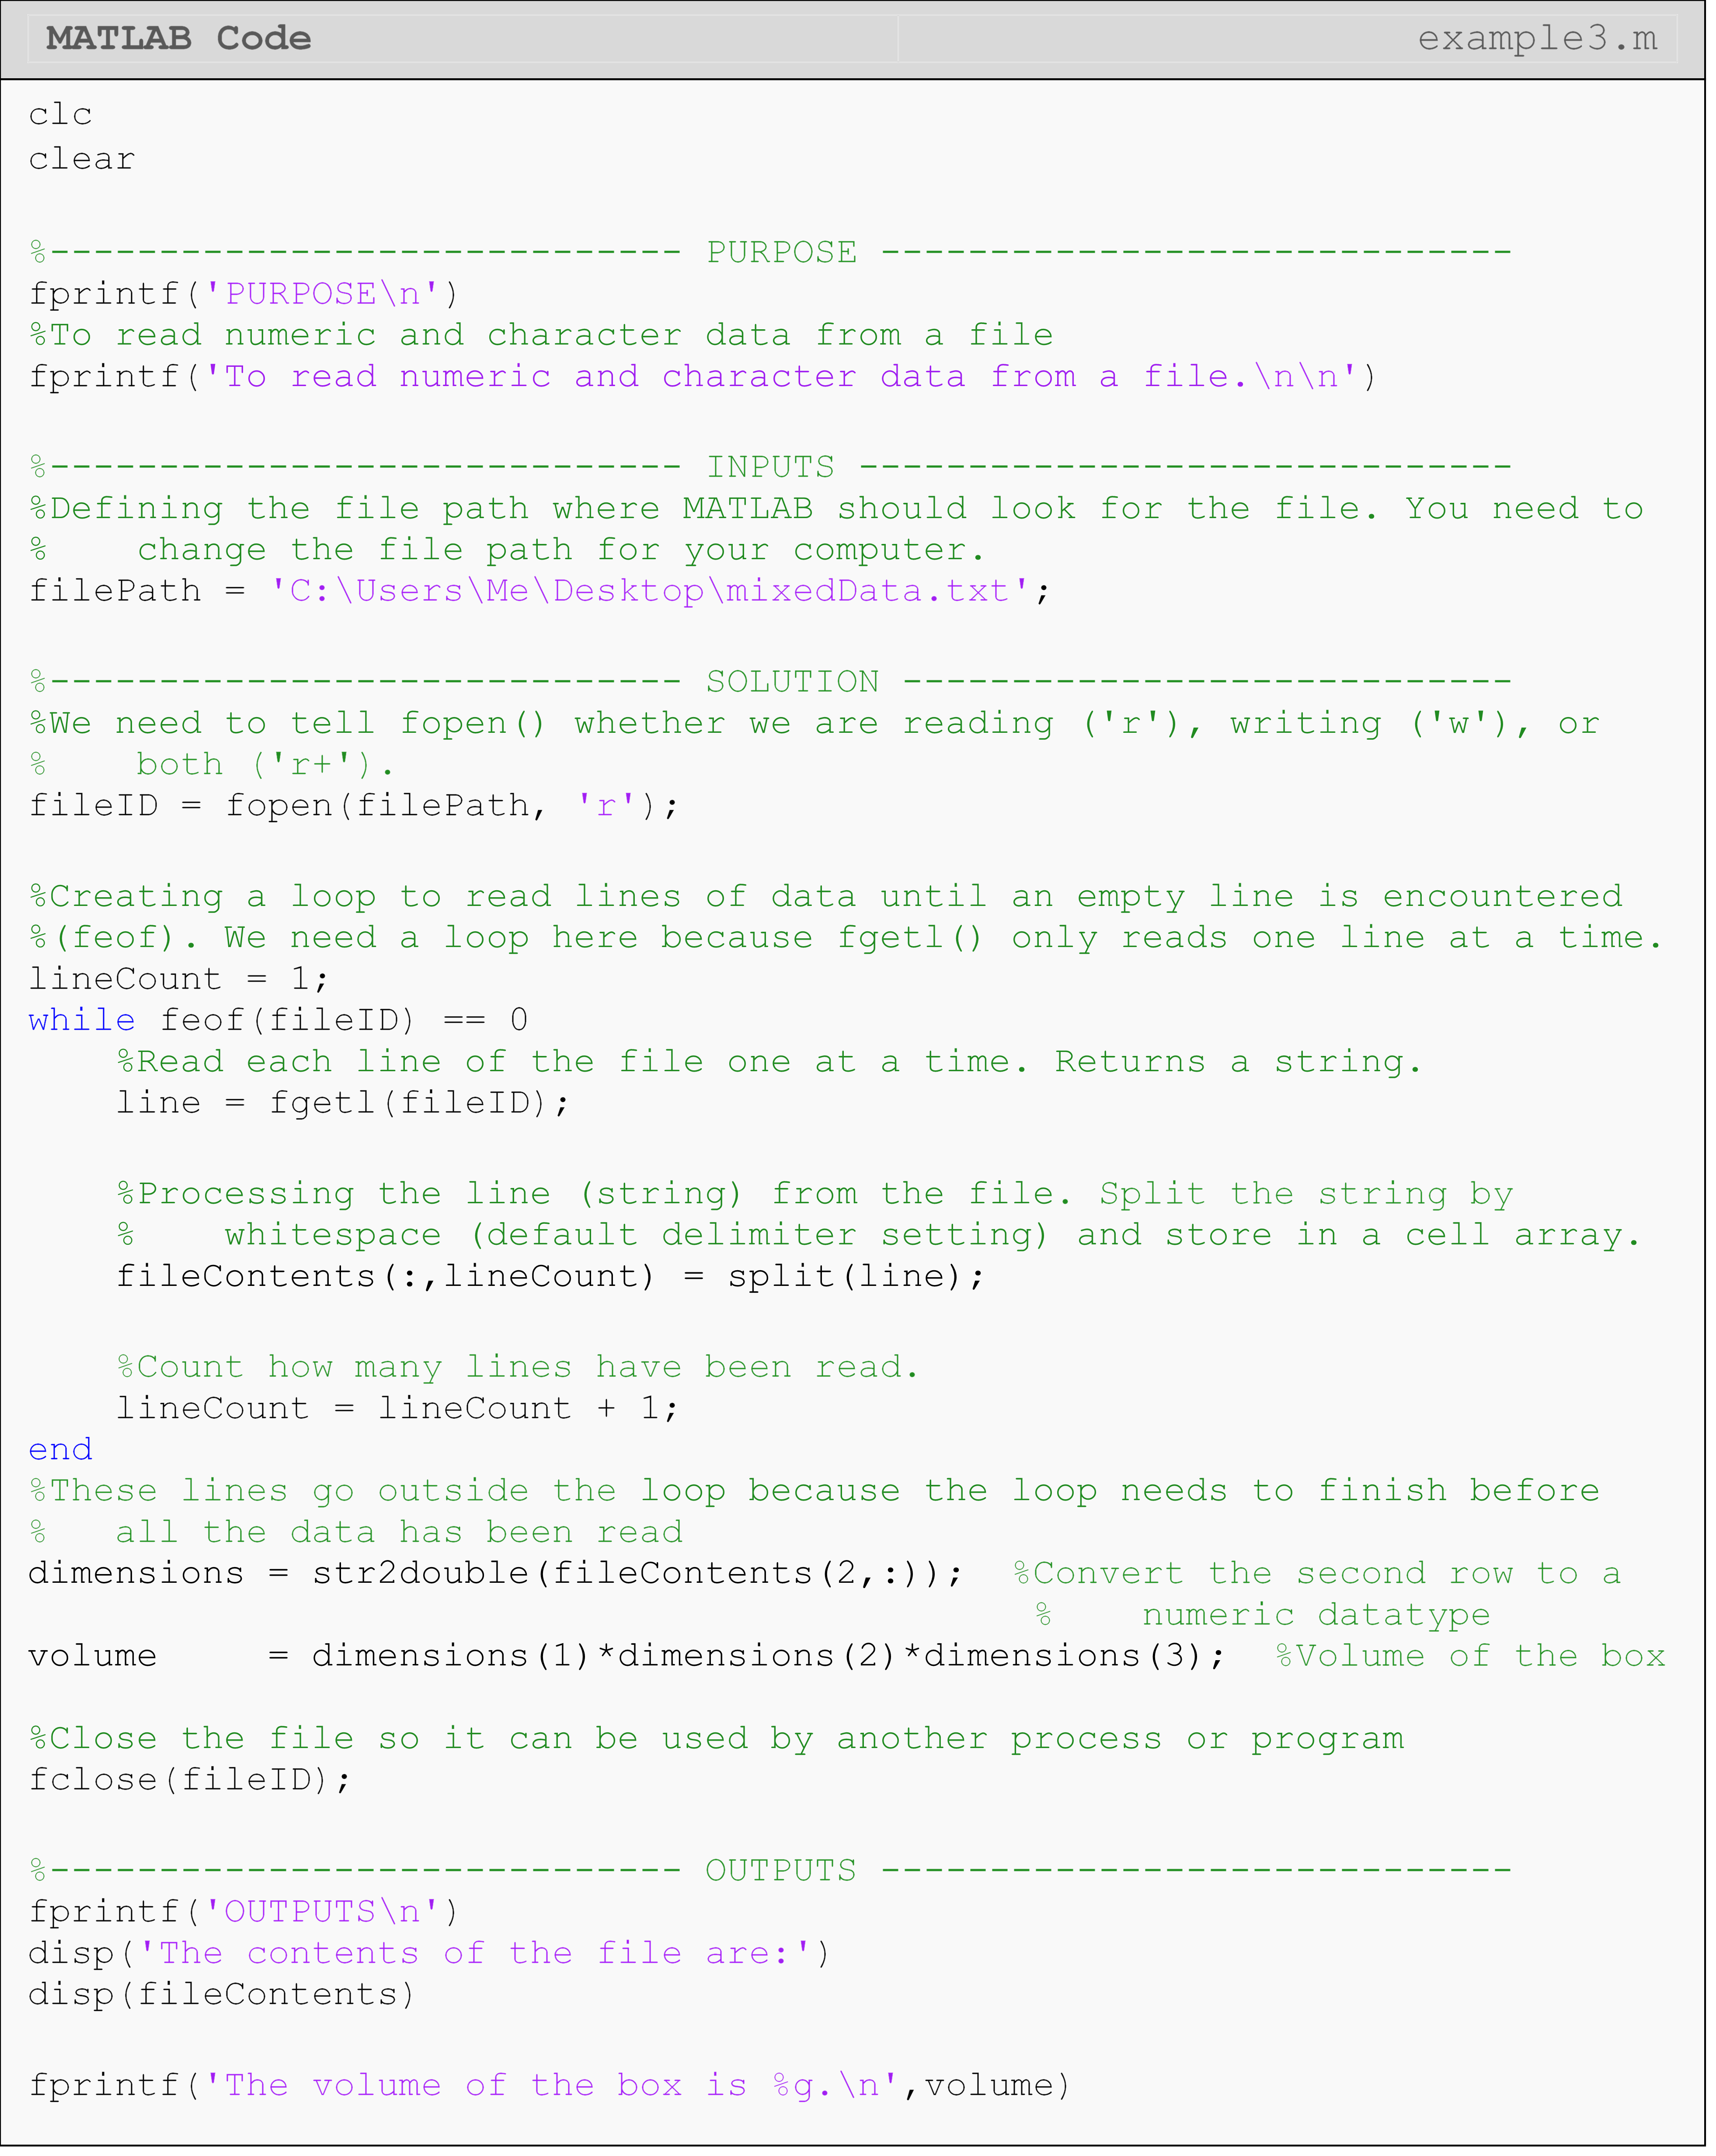

To open the file for reading, we use
fopen().
To watch for the end of the file, we can use
feof(), which
checks the next line from the current one to see if there is any data.
If feof() does
not see any data on the next line, it will return a 1. Otherwise, it
returns 0. Finally, we use
fclose() to
close the file we are reading. We did not need to do this for
dlmread() or xlsread() because those functions close the file
automatically when they are done reading.
fgetl()
returns a string. If we want to reformat the line, to work with numeric
data for example, we can use
split()
to separate the pieces of the string. From there, we can use the
str2double()
or similar to convert to the desired data type (see Data Types (Lesson
2.5) for more details on conversion).
Lesson Summary of New Syntax and Programming Tools
| Task | Syntax | Usage |
|---|---|---|
| Read a file containing numeric-only data into MATLAB | dlmread() |
dlmread(myPath,'\t') |
| Read an Excel file containing numeric and character data into MATLAB | xlsread() |
[num,text] = xlsread(myPath) |
| Open a file for reading from or writing to with MATLAB | fopen() |
fileID = fopen(myPath, 'r') |
| Close a file MATLAB has opened | fclose() |
fclose(fileID) |
| Check to see if the end of an open file has been reached | feof() |
feof(fileID) |
| Read a line from a file with MATLAB | fgetl() |
fgetl(fileID) |
| Split a string | split() |
split(strLine) |
| Convert a string to a double data type | str2double() |
str2double(var) |
Multiple Choice Quiz
(1). The
dlmread()
function can read files containing
(a) numeric-only
(b) character-only
(c) numbers and characters
(d) None of the above
(2). The
xlsread()
function can read files containing
(a) numeric-only
(b) character-only
(c) numbers and characters
(d) None of the above
(3). The function to open a file for reading is
(a) fgetl()
(b) fopen()
(c) fprintf()
(d) open()
(4). To read a line of an external text file, the function is
(a) fgetl()
(b) fopen()
(c) read()
(d) fprintf()
(5). You are asked to open the file, ‘problem3.txt’, for reading. Which is the correct choice to complete the following code (your choice will be added at the end of the given m-file)?
(a) open(file)
(b) fopen(file,'r')
(c) fopen(file,'w')
(d) fopen(file,'o')
Problem Set
(1). Make a text file as shown in Figure A.

Figure A: Data file for Exercise 1.
Using MATLAB, write a program that reads the above data file and sums all of the numbers in the first and second rows separately (you should have two sums). Multiply the sum of the first row by the sum of the second. Display the input vectors, and the output product in the Command Window using fprintf() and/or disp().
(2). Read the data from the text file into MATLAB and store it in a matrix. The first column of [A] contains the x data and the second column contains the y data. Plot the data on a 2D plot and label each of the two axes.
\[\left\lbrack \text{A} \right\rbrack = \begin{bmatrix} \begin{matrix} \text{1}\text{} & \text{1} \\ \text{2}\text{} & \text{4} \\ \text{3}\text{} & \text{9} \\ \end{matrix} \\ \begin{matrix} \text{4} & \text{16} \\ \text{5} & \text{25} \\ \text{6} & \text{36} \\ \end{matrix} \\ \end{bmatrix}\]
(3). A fuel cell on a satellite is used to power a servomotor. The fuel cell heats up while it is powering the motor. To measure the cooldown time, the interior temperature of the fuel cell is recorded once it is turned off. The text document in Figure B provides the temperature and corresponding time data points. The first column is the temperature (Celsius) of the cell, and the second is the corresponding time (sec).
Read the text file in Figure B by an m-file into two vectors to store the data (temp and time). Plot the temperature of the fuel cell vs. time. Use appropriate figure title and axis labels.

Figure B: Fuel cell temperature and time measurements.
(4). To find contraction of a steel cylinder, one needs to regress the thermal expansion coefficient data to temperature. The data is given below.
Table D: The thermal expansion coefficient of steel at given temperatures.
| Temperature, T, \((^\circ\text{F})\) | Coefficient of thermal expansion, \(\alpha\), \((\text{in/in/}^\circ\text{F})\) |
|---|---|
| 80 | 6.47 * 10^-6 |
| 40 | 6.24 * 10^-6 |
| -40 | 5.72 * 10^-6 |
| -120 | 5.09 * 10^-6 |
| -200 | 4.30 * 10^-6 |
| -280 | 3.33 * 10^-6 |
| -340 | 2.45 * 10^-6 |
Put the above data in a two-column format in a text file.
(a) Read the above data into two vectors, temp and alphaVal.
(b) Fit the above data to by using the polyfit() function. Plot the regression model along with the data points. Use proper axis labels, title, and legend in the figure.
(c) Find the predicted value of the coefficient of thermal expansion at \(\text{T} = - 100^{\circ}\text{F}\).
(d) If the steel cylinder is dipped in a dry-ice/alcohol bath, the diametric contraction, \(\mathrm{\Delta}\text{D}\), in the steel cylinder is given by
\[\Delta D = D\int_{T_r}^{T_f}\alpha dT\]
where,
\(D\) = outer diameter of the cylinder,
\(T_{r}\)= room temperature,
\(T_{f}\)= dry-ice/alcohol temperature
Find the diametric contraction.
(e) The contraction obtained in part (d) is not adequate, as specifications require a diametric contraction of at least 0.02”. Find the temperature of the cooling medium you would need to achieve that much contraction.
(f) Find the rate of change of diametric contraction at and. What do you conclude from these results?
(5). Write a MATLAB program that reads the input text file given in Figure C, and outputs (to the Command Window) the longitudinal Young’s modulus of the composite material. To find the Young’s modulus, you may use the following regression model
\[E = \frac{\sum_{i = 1}^{n}\sigma_i \varepsilon_i }{\sum_{i = 1}^{n}(\varepsilon_i)^2}\]
where,
\(E\) is Young’s modulus (Pa),
\(\varepsilon\) is the strain (m/m),
\(\sigma\) is the stress (Pa),
\(n\) is the number of data points.
A tensile test of a composite material has provided the stress-strain data that is given in Figure C. The strain (cm/cm) and stress (MPa) are given in the first and second columns, respectively.
Use the fprintf() function with %e format to display your output in the
Command Window. Be sure to note the units.

Figure C: Strain and stress values of a composite material.