Module 6: PROGRAM DESIGN AND COMMUNICATION
Learning Objectives
After reading this lesson, you should be able to:
identify flowchart symbols,
construct a flowchart for a program,
read a flowchart.
What is a flowchart?
A flowchart is the combination of geometric symbols connected with arrows (called flowlines) that represent steps in a process. Each geometric symbol has a meaning (for example, a rectangle represents a process), and is filled with necessary information (for instance, a formula in a process). Flowcharts are commonly used as a tool to help layout and plan large-scale processes and programs. It is also very common to find flowcharts as part of engineering plans and corporate meetings. Table 1 shows commonly used flowchart symbols with their meaning.
Table 1: Common flowchart symbols and meanings.
| Symbol | Title | Meaning |
|---|---|---|
 |
Flowline | connect symbols and indicate the flow of logic. |
 |
Terminal | To represent the beginning or end of a task. |
 |
Input/Output | For input and output operations. |
 |
Processing | For arithmetic and data manipulation operations. |
 |
Decision | For the logic of comparison operations. |
 |
Connector | Used to join different flowlines. |
 |
Predefined Process | To represent a group of statements that performs one processing task. |
 |
Annotation | To provide additional information about another flowchart symbol. |
 |
Loop | Used for loops/repetition |
 |
Offpage Connector | To indicate that the flowchart continues to a second page. |
Example 1
Hero’s formula for calculating the area of a triangle with the length of the three sides as a, b, c is given by,
\(A = \sqrt{s(s - a)(s - b)(s - c)}\),
where
s is the semi-perimeter of the triangle, that is,
\(s = \frac{a + b + c}{2}\).
The perimeter of the triangle is given by
\[P = a + b + c\]
Construct a flow chart for calculating the perimeter and area of a triangle.
Solution
(Flowchart is shown on the next page.)
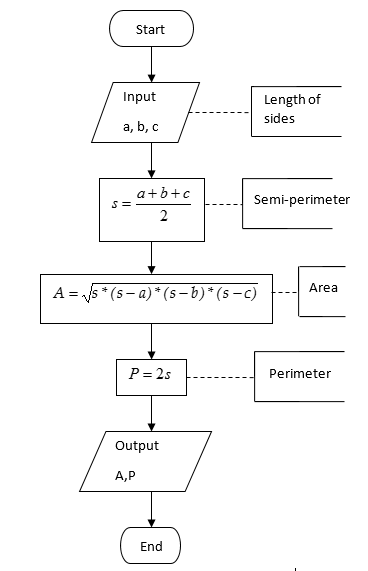
Figure 1: Flow chart for calculating the area and perimeter for a triangle.
Example 2
So, you want my phone number and need to know my BMI? How shallow can you be? In 1998, the federal government introduced the body mass index (BMI) to determine healthy weights.
Body mass index is calculated as 703 times the weight in pounds divided by the square of the height in inches. The obtained number is then rounded off to the nearest whole number (Hint: 23.5 will be rounded to 24; 23.1 will be rounded to 23; 23.52 will be rounded to 24). The criteria for a healthy weight are given as follows.
Table 2: Range of BMI values.
| Range of BMI | Meaning of Range |
|---|---|
| \(BMI<19\) | Unhealthy weight |
| \(19\leq BMI\leq 25\) | Healthy weight |
| \(BMI>25\) | Unhealthy weight |
Construct a flow chart for the above example that will determine whether a person has a healthy or unhealthy weight, based on a person’s weight and height.
Solution
A person’s BMI is calculated by the formula
\(BMI = \frac{weight(lbs)}{\lbrack height(in)\rbrack^{2}} \times 703\).
The steps in the algorithm are:
Enter the person’s weight in lbs and height in inches.
Calculate BMI using, \(BMI = \frac{weight(lbs)}{\lbrack height(in)\rbrack^{2}} \times 703\).
If BMI is not in the range of 19 and 25, then the person has an unhealthy weight, else the weight is healthy.
The flowchart for this problem is shown in Figure 2.
(Flowchart is shown on next page)
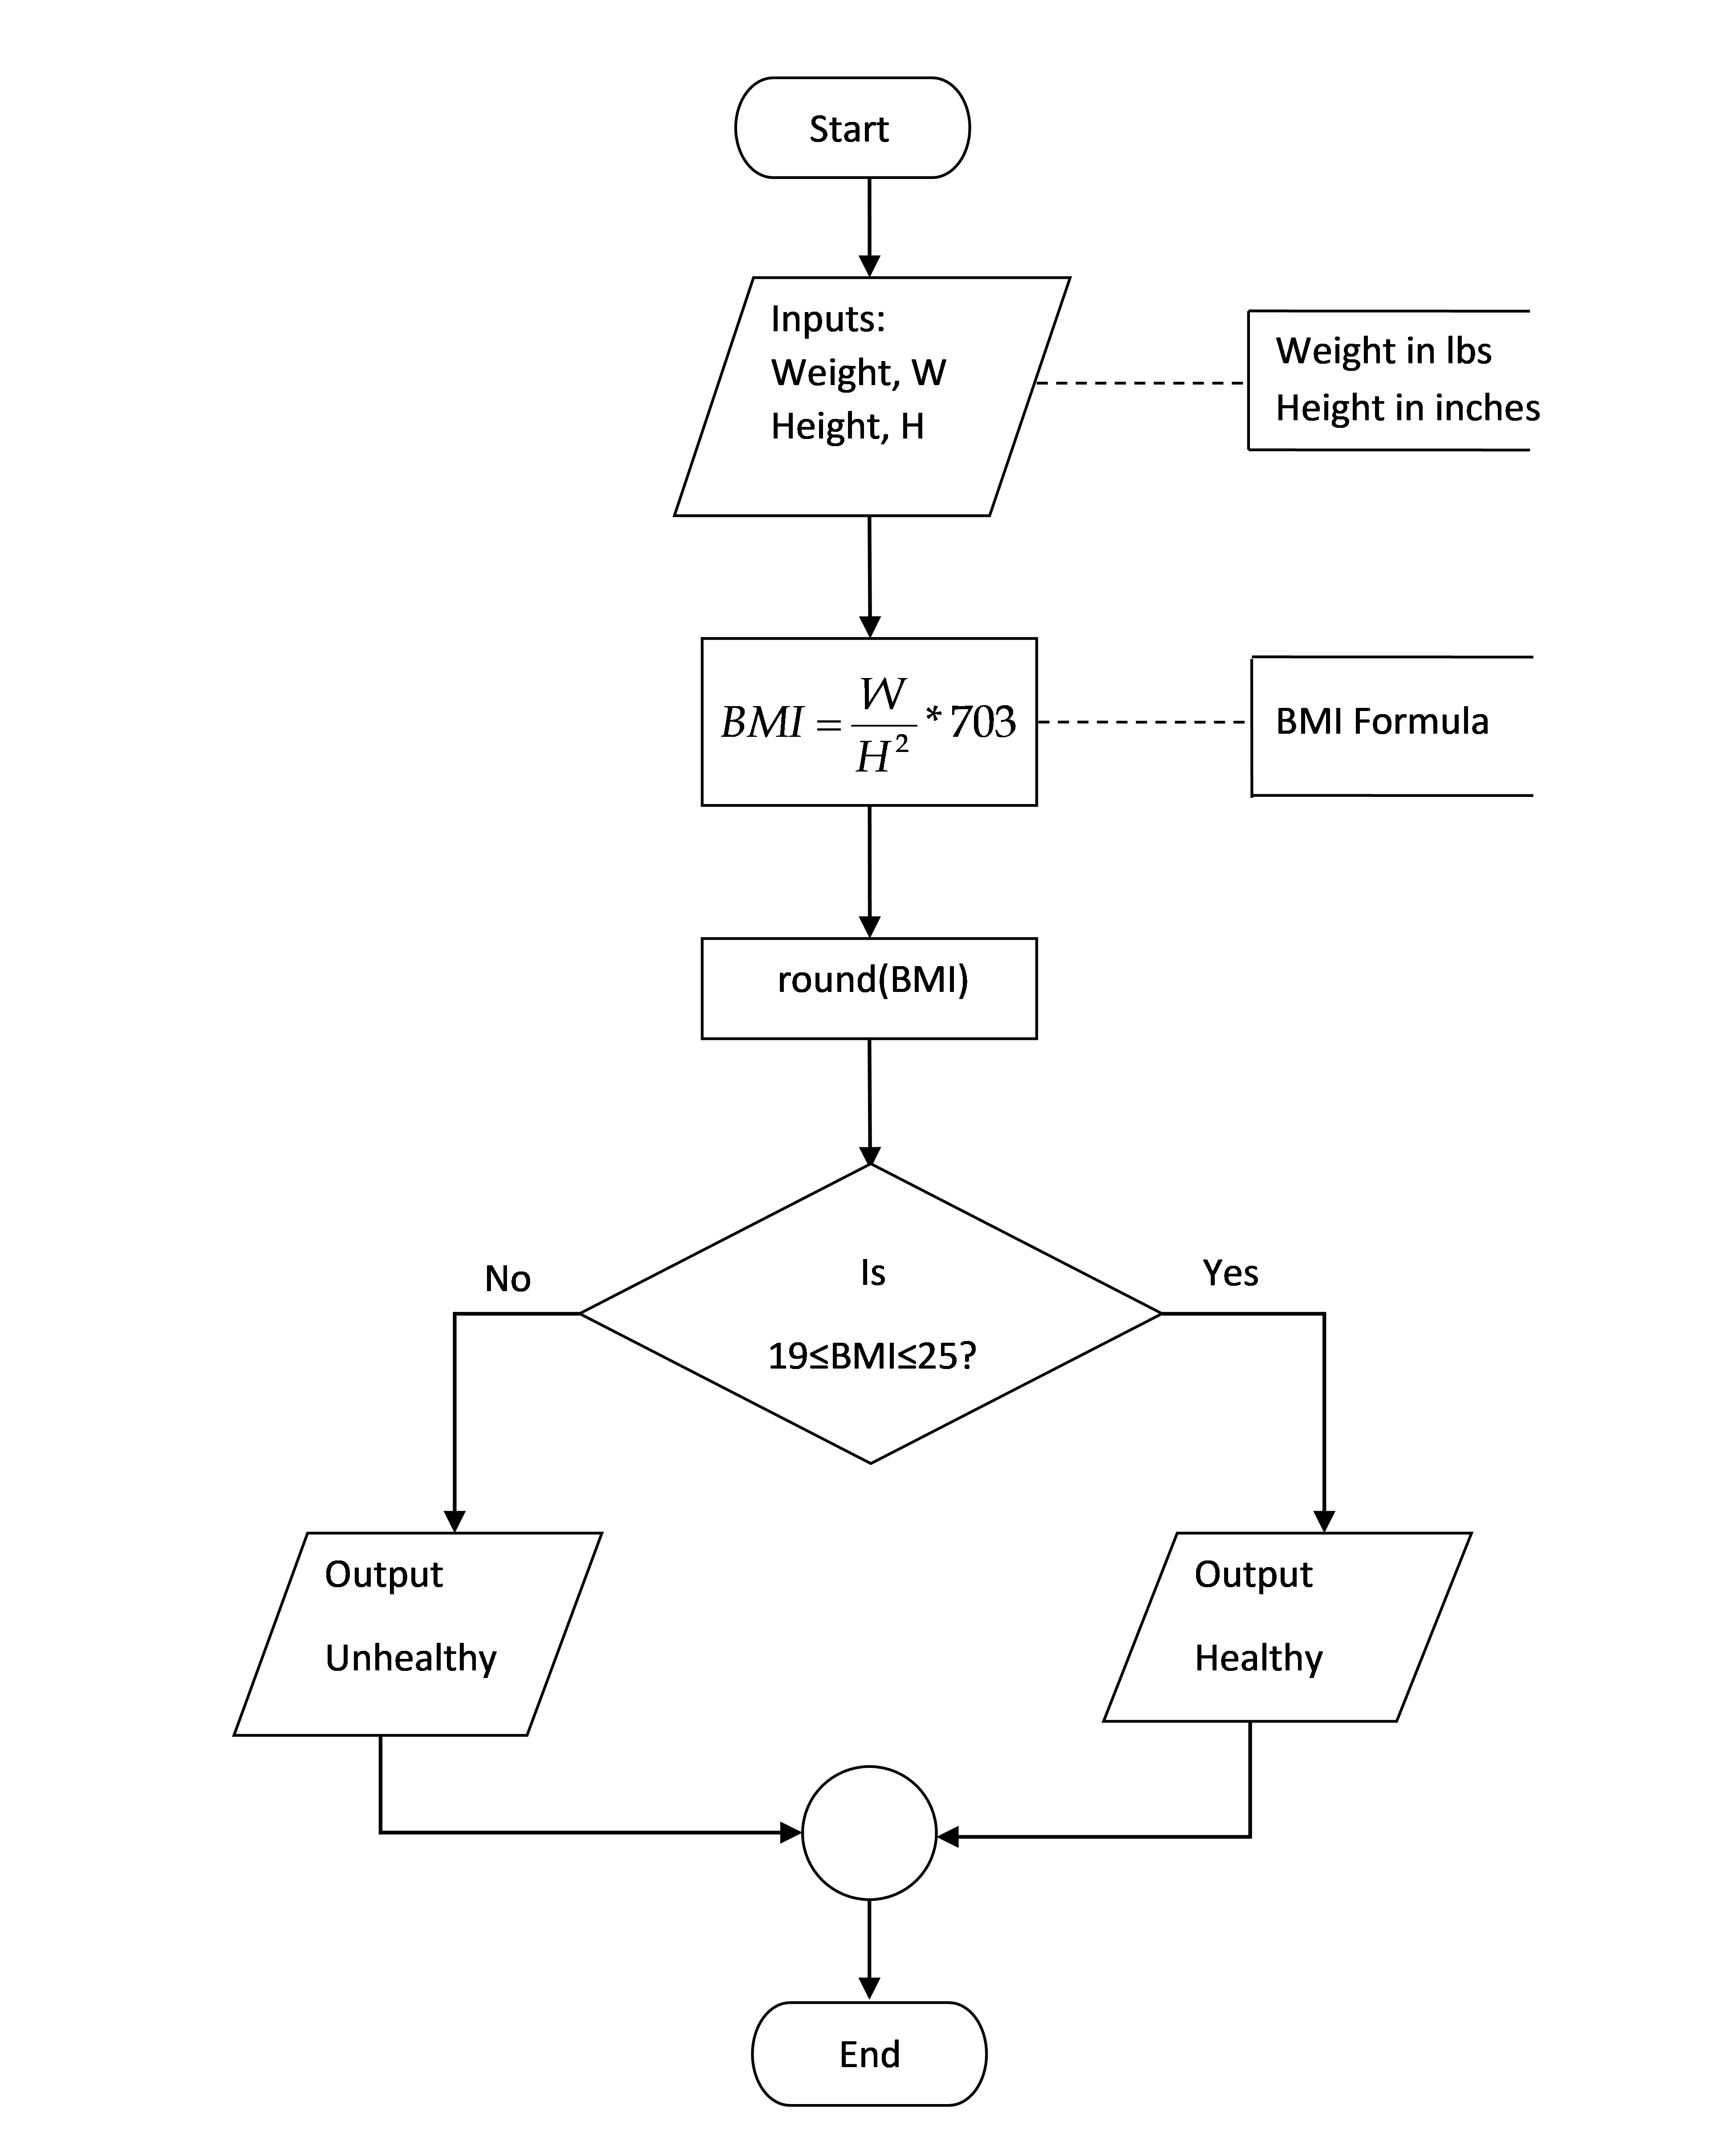
Figure 2: Flow chart for calculating a person’s BMI.
Example 3
The function \(e^x\) can be calculated by using the following infinite Maclaurin series:
\[e^{x} = 1 + x + \frac{x^{2}}{2!} + \frac{x^{3}}{3!} + \cdots\]
Make a flowchart for finding \(e^{x}\) using the first n terms of the Maclaurin series.
Solution
This solution uses loops to develop the flowchart. Although loops have not been covered in this book yet (Module 8), loops are simply a repetitive task, starting and ending at some value. An example of using a loop is a summation series.
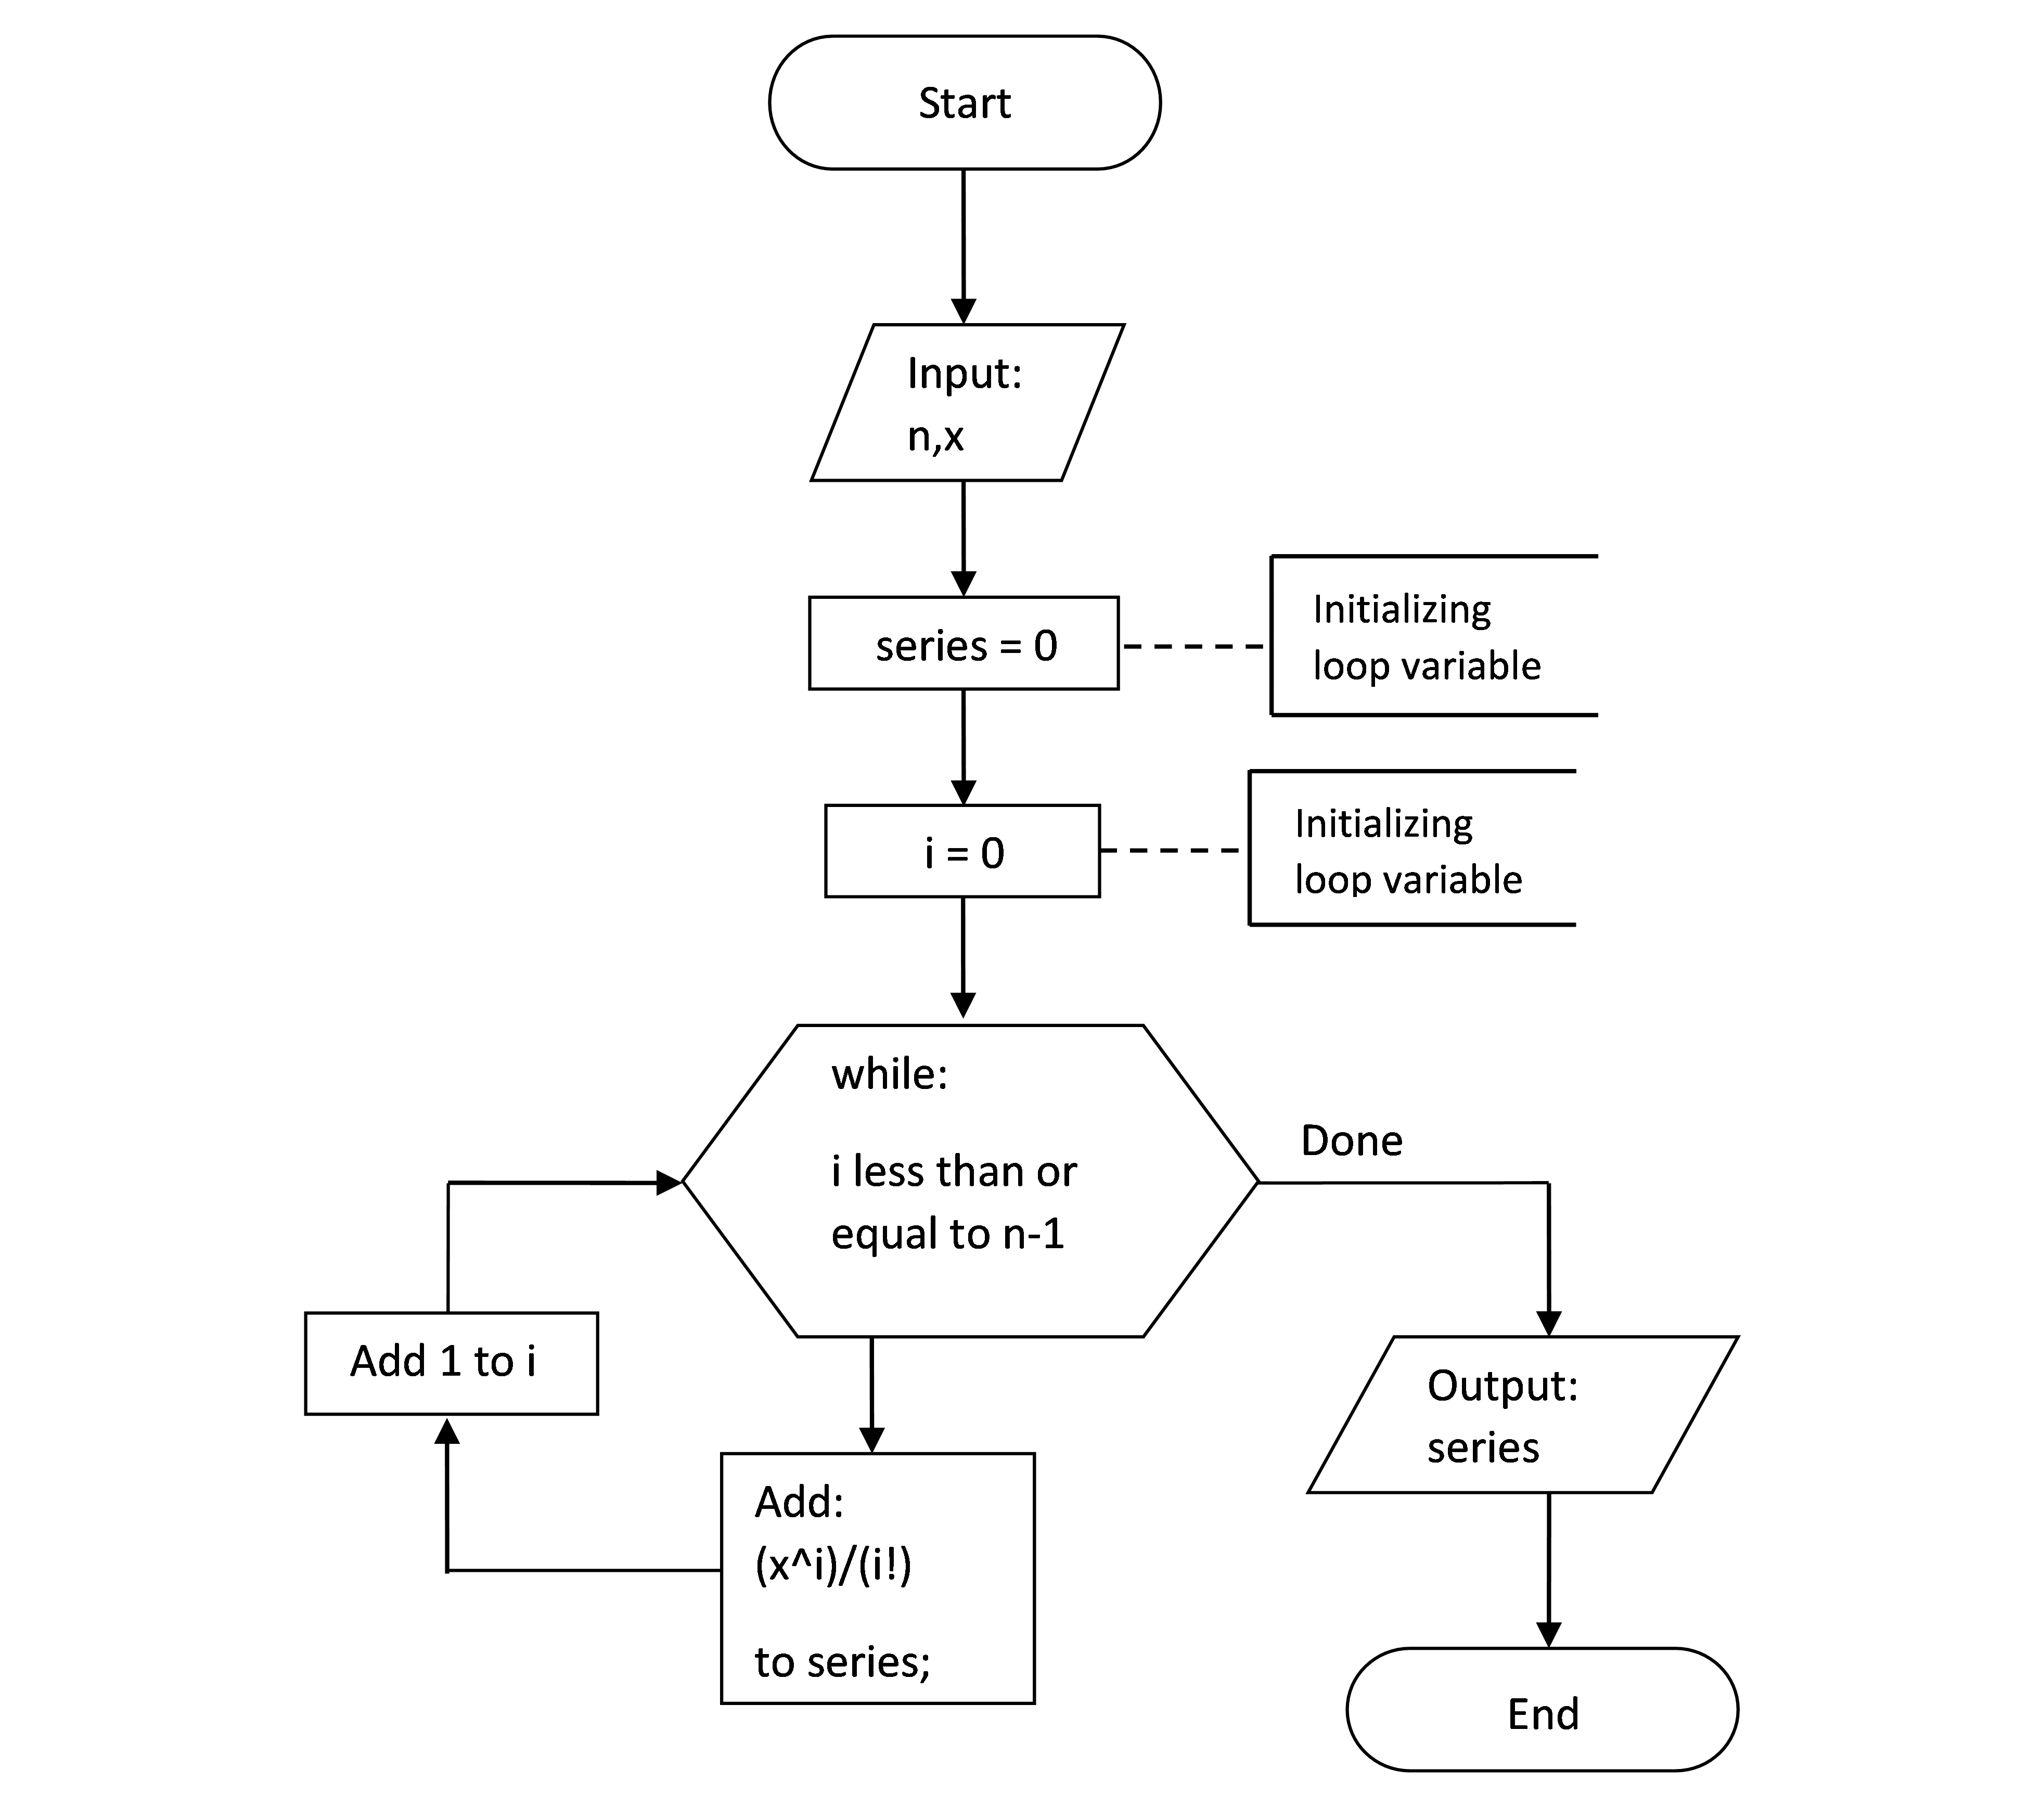
Figure 3: Flowchart for calculating \(e^x\) using the Maclaurin Series.
Multiple Choice Quiz
(1). The flowchart symbol for a process is
(a) 
(b) 
(c) 
(d) 
(2). The  symbol in a flowchart represents
(a) the direction that information travels in a process.
(b) the direction of least resistance in a process.
(c) the reverse direction of data flow.
(d) a visual distraction.
(3). The flowchart symbol for a decision is
(a)
(b)
(c)
(d)
(4). The  flowchart symbol, , is used to
(a) specify a process.
(b) start or end a flowchart.
(c) link two or more flowlines.
(d) add a new input or output.
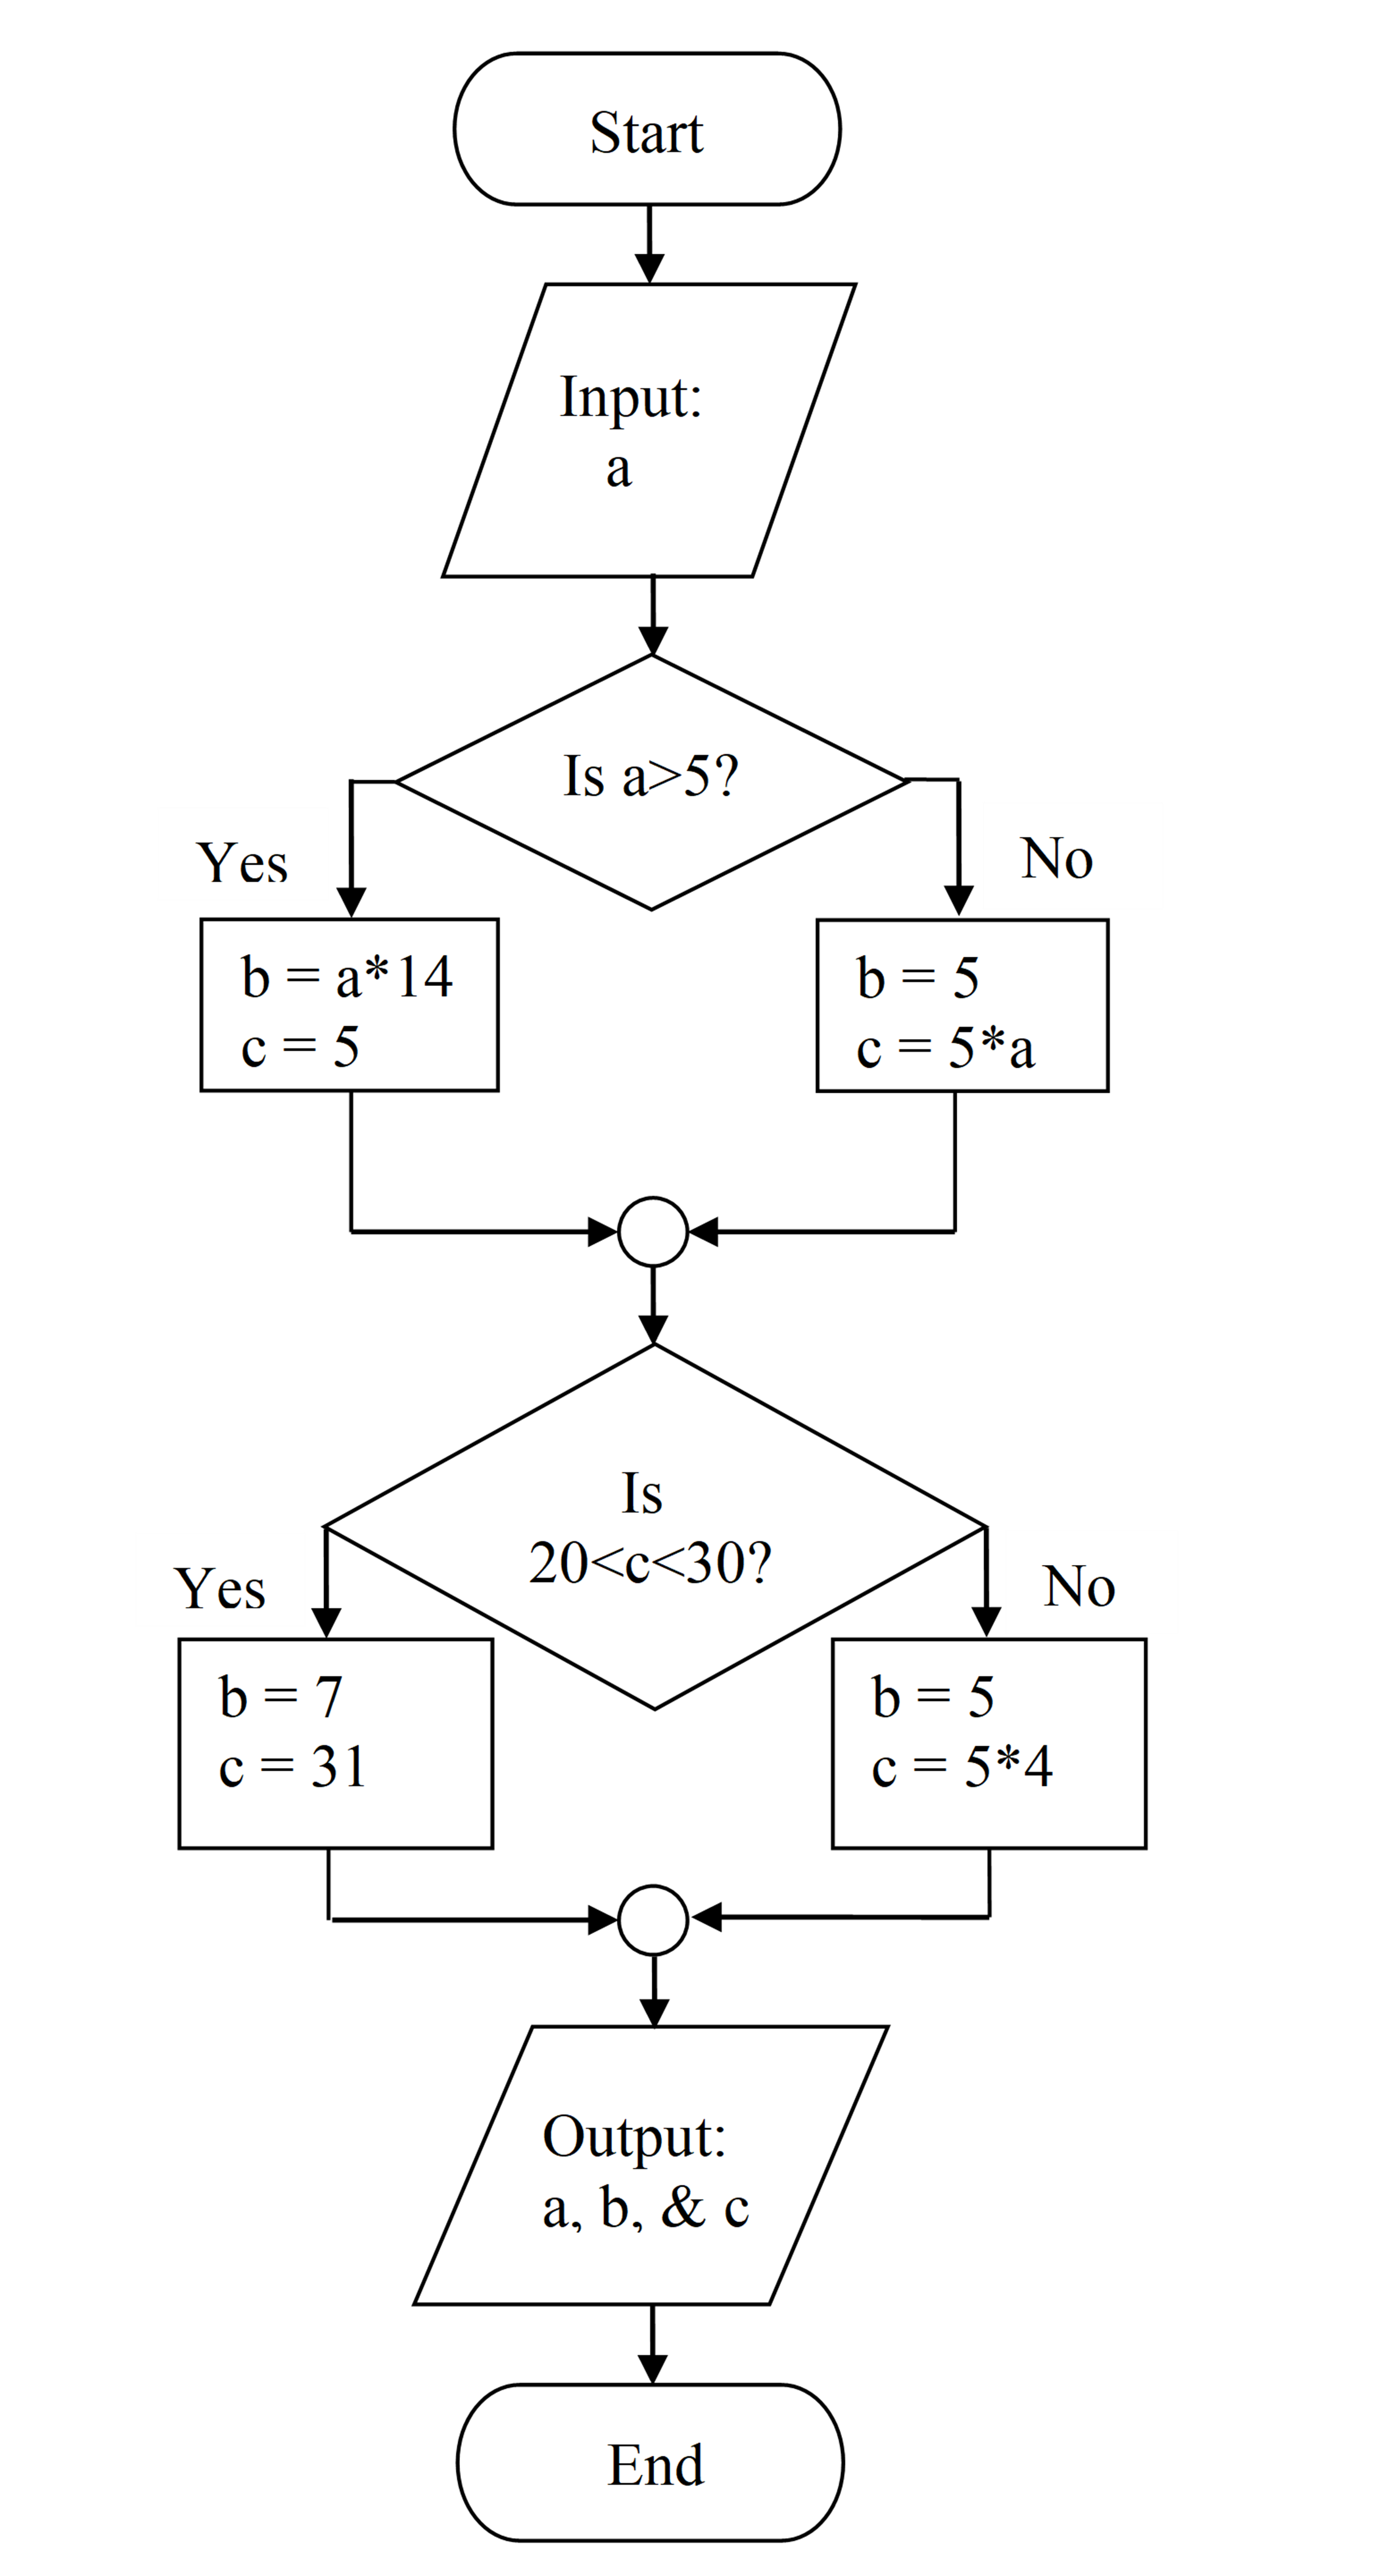
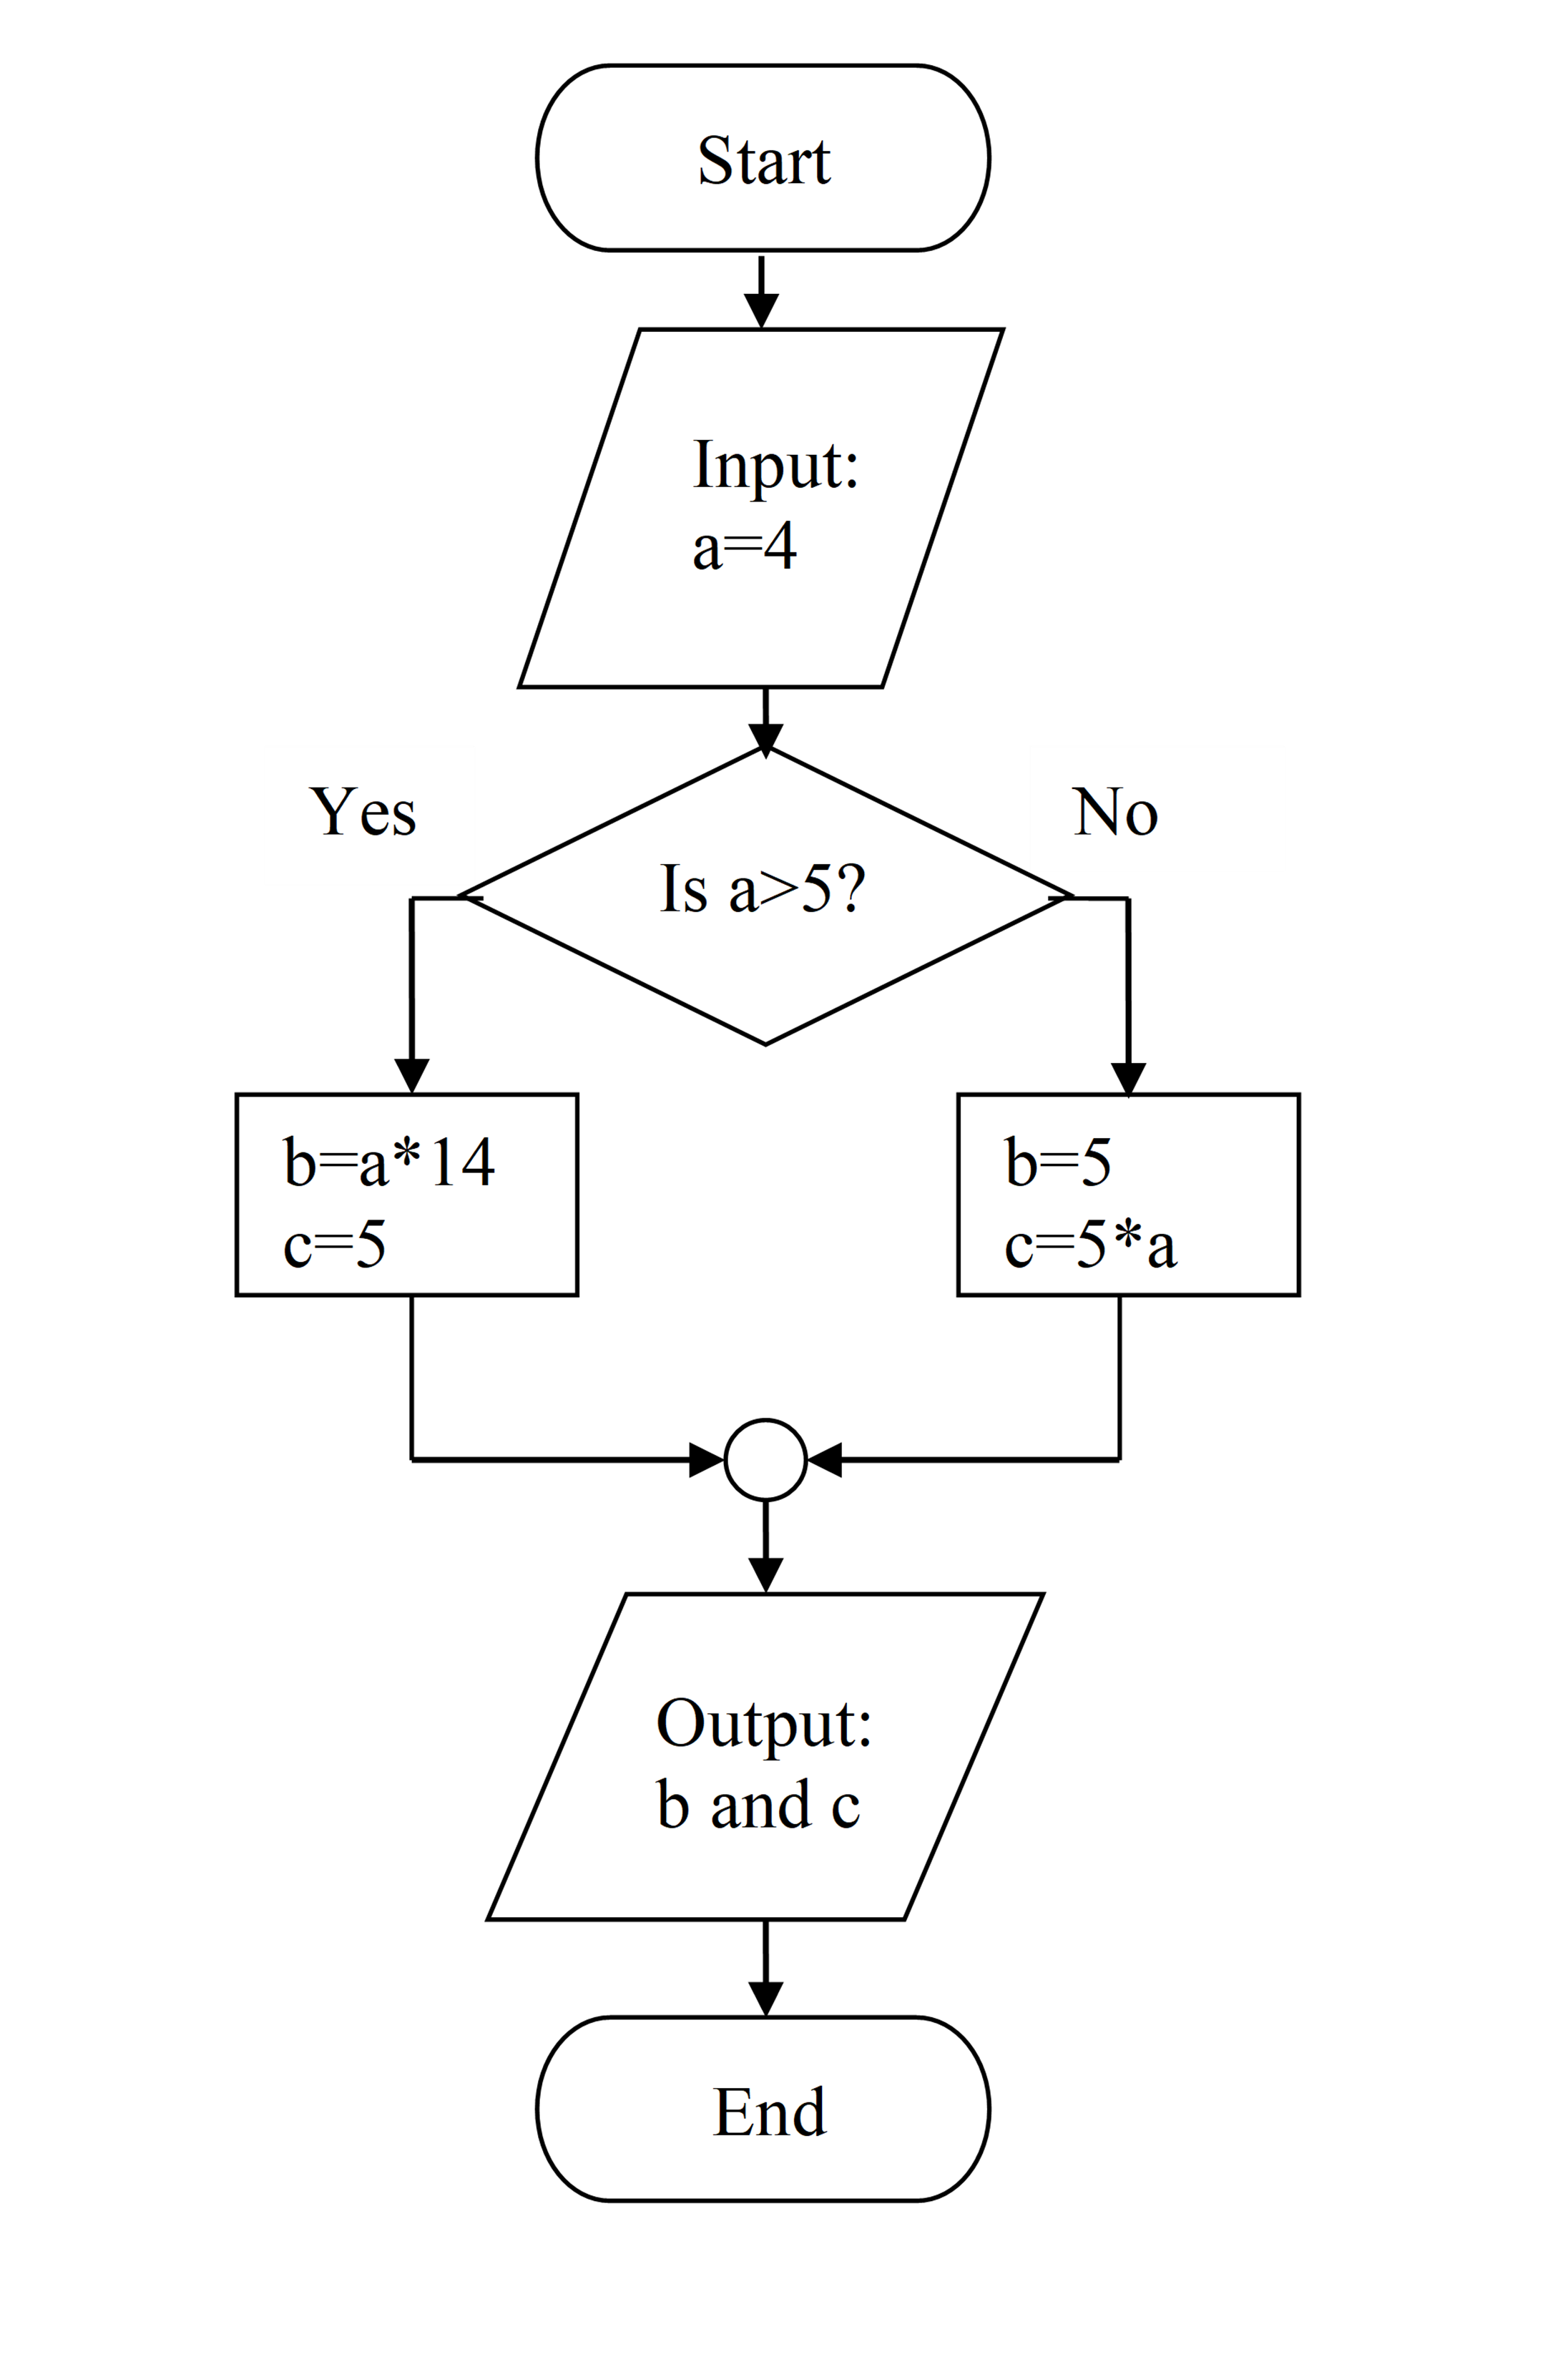
(5). Given the following flowchart, what would be the output
(a) a = 4, c = 5
(b) b = 56, c = 5
(c) b = 5, c = 20
(d) b = 20, c = 5
Problem Set
(1). Construct a flowchart for the process of finding the area of a trapezoid, given the length of the two parallel sides and the perpendicular distance between the parallel sides.
(2). Construct a flowchart for determining if an object will fit in a three-dimensional box. To do this, compare the dimensions of the object to the dimensions of the box. Both sets of dimensions should be inputs to the program.
(3). Construct a flowchart for determining if a given number is positive, zero, or negative.
(4). Construct a flowchart for the process of finding the depth to which a spherical metal ball is submerged under water, given the density of the metal, the outer radius, and the wall-thickness of the ball. Assume the density of water is 1000 kg/m3.
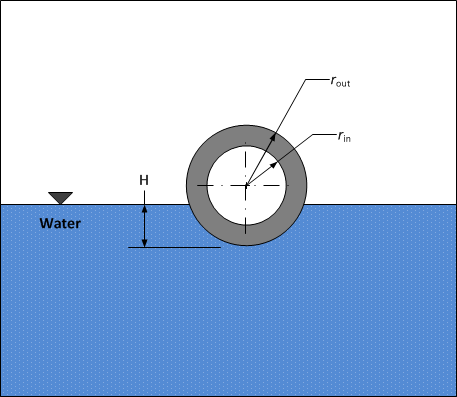
Figure A – Metal ball floating in water.
Hint: Apply Archimedes principle. The volume of the ball under water for a given depth, H is
\[V = \frac{\pi H^{2}\left( 3r_{\text{out}} - H \right)}{3}\]
(5). Convert the following flowchart into a MATLAB program.